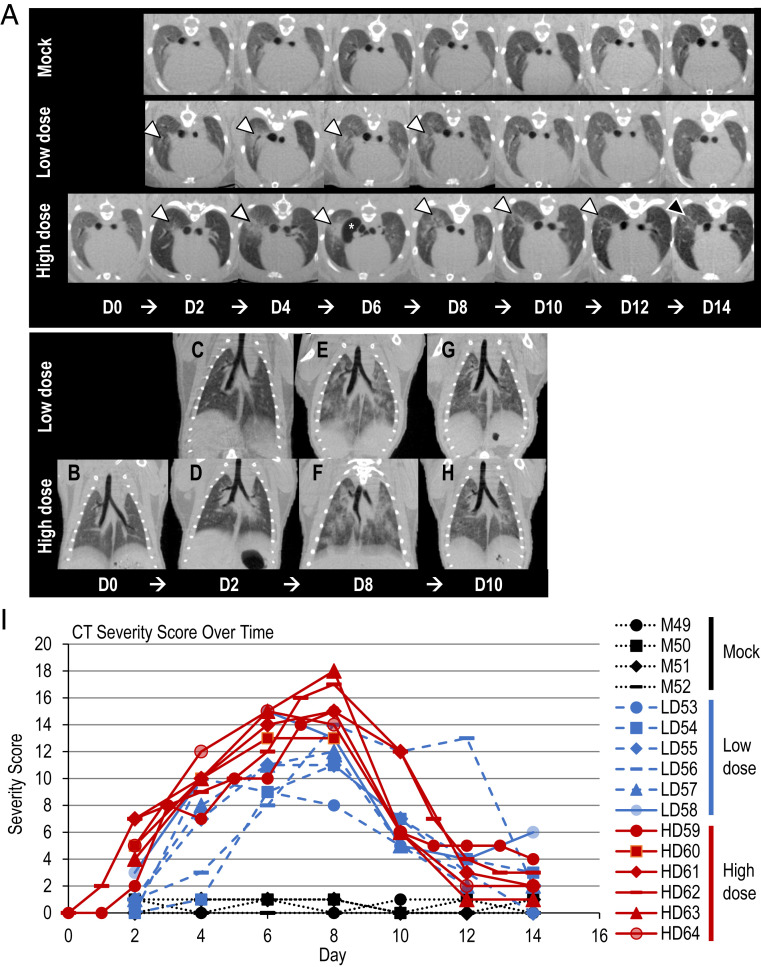
Fig. 4.
Micro-CT imaging of the lungs of infected Syrian hamsters. (A) Axial CT images of the thorax in mock-infected control, low dose-infected, and high dose-infected animals showing lung abnormalities over a 14-d period (white arrowheads). Lung abnormalities were first detected 2 d postinfection, and the most severe changes were observed 8 d postinfection in virus-infected animals. The high dose-infected animals had, overall, more severe lung abnormalities compared to the low dose-infected animals. Lung abnormalities began to improve 10 d postinfection for both low dose- and high dose-infected animals. On day 14 postinfection, the high dose-infected animals had a higher degree of residual lung abnormalities compared to the low dose-infected animals, highlighted by the black arrowhead. Pneumomediastinum is labeled by the white asterisk (*). Note that the day 0 control image was only obtained for the high dose-infected animal and is not available for the low dose-infected or mock-infected animals. (B–H) Dorsal/coronal plane reconstruction CT images of the thorax in low dose-infected and high dose-infected animals showing (B) a control image, (C and D) initial lung changes, (E and F) most severe lung changes, and (G and H) the beginning of the recovery phase over time. The high dose-infected animals had more severe lung abnormalities than the low dose-infected animals. Note that the day 0 control image was only obtained for the high dose-infected animals and is not available for the low dose-infected animals. (I) CT severity score of mock-infected control and infected Syrian hamsters. CT Severity Score over time for mock-infected control, low dose-infected, and high dose-infected animals over 14 d. Low dose- and high dose-infected animals had severe lung abnormalities as demonstrated by high CT severity scores compared to mock-infected control animals. High dose-infected animals had a higher CT severity score compared to low dose-infected animals. CT abnormalities were first detected 2 d postinfection, the most severe changes peaked at 6 d to 8 d postinfection, and the recovery period began 10 d postinfection. Mild lung abnormalities, as indicated by lower CT severity scores, persisted at 14 d postinfection in most of the infected animals.

