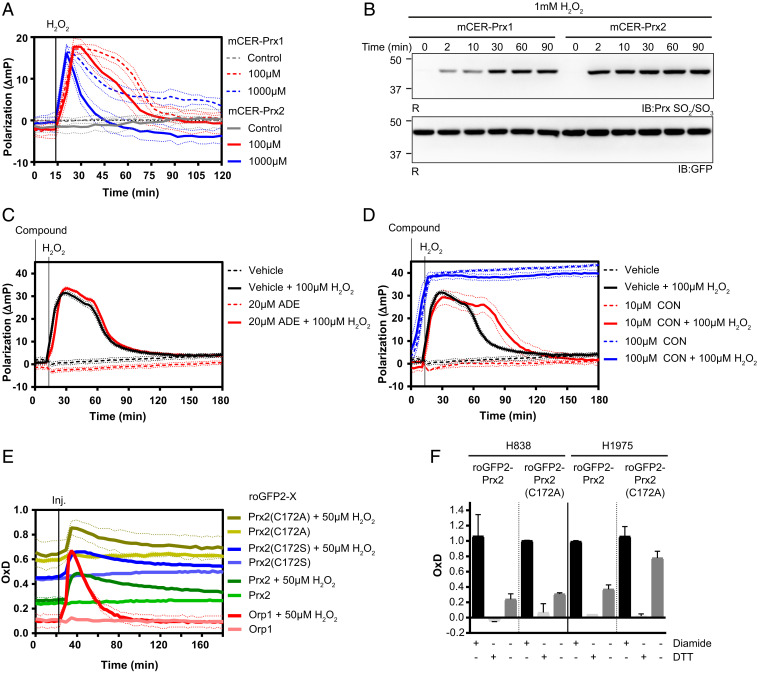
Fig. 5.
Applications for mCER-Prx2 and related probes. (A) Comparison of the polarization response associated with mCER-Prx1 and mCER-Prx2 in response to H2O2. (B) Hyperoxidation of mCER-Prx1 and mCER-Prx2 in response to H2O2 (1 mM), as analyzed by reducing (R) gel electrophoresis and immunoblotting. (C) mCER-Prx2 polarization response to adenanthin (ADE) in the presence or absence of H2O2. (D) mCER-Prx2 polarization response to conoidin A (CON) in the presence or absence of H2O2. (E) Degree of oxidation (OxD) measurements for various roGFP2 fusion (roGFP2-X) proteins [roGFP2-Prx2, roGFP2-Prx2(C172A), roGFP2-Prx2(C172S) and roGFP2-Orp1] expressed in HEK293 cells, at steady state and in response to H2O2. (F) Steady-state OxD measurements for roGFP2-Prx2 and roGFP2-Prx2(C172A), as expressed in two non-small-cell lung cancer cell lines (H838 and H1975), together with reference treatments (diamide for full oxidation, DTT for full reduction). The bars indicate the mean ± SEM. All graphs in this figure are based on n = 3 biological replicates with six technical replicates each. All immunoblots in this figure are representative of n ≥ 3 experiments.

