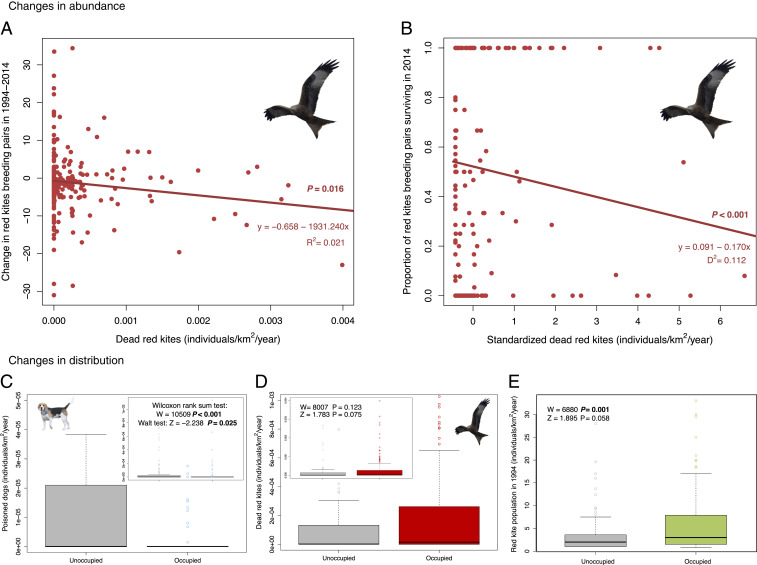
Fig. 2.
Main factors explaining changes in red kite occupancy and abundance in 1994 to 2014. (A) When raw data were considered, the density of dead red kites (both confirmed and suspected as poisoned) negatively correlated with the observed changes in the number of breeding pairs per 10 × 10-km square (n = 274). Although this linear relationship weakened after removing the influential point, x = 0.004 (i.e., P > 0.05), this point had no effect in the best model, further supporting the observed negative trend. (B) Dead red kites explaining the variation in the proportion of breeding pairs surviving in 2014 when included in the final best model, while keeping the remaining variables constant at their mean values; that is, locations with greater numbers of dead kites had lower proportions of surviving pairs. (C–E) In agreement with the occupancy models for breeding kites, raw data showed that locations where red kite breeding pairs disappeared between 1994 and 2014 (n = 107) had more dogs confirmed as poisoned (C), fewer dead red kites (both confirmed and suspected as poisoned) (D), and a smaller breeding population (E) in 1994. Wilcoxon tests show differences for the raw data. Wald tests for each variable once included in the final best model are provided for comparisons. Significant P values (<0.05) are in bold type. Additional details are provided in Materials and Methods and SI Appendix, Table S3. (Red kite image and dog image credit: Public Domain Pictures/George Hodan and Pixabay/AlbanyColley.)

