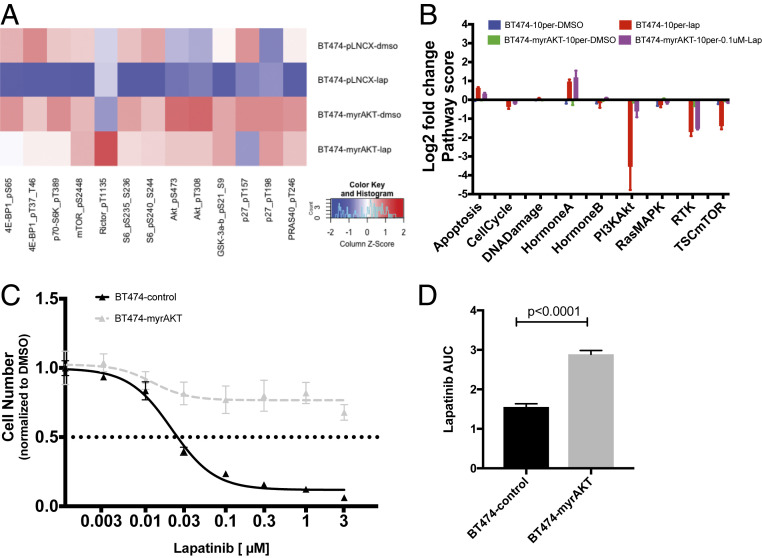
Fig. 4.
Overexpression of AKT results in sustained MTOR signaling despite lapatinib treatment and reduces lapatinib sensitivity. (A) Heatmap of absolute protein expression levels of MTOR and PI3K/AKT pathway members in control BT474 cells (pLNCX) and AKT-overexpressing BT474 (myrAKT) under no-treatment (dimethyl sulfoxide [DMSO]) and lapatinib-treatment (0.1 μM) conditions. Data are average median-normalized values for at least two biological replicates. Red indicates protein increase compared to median, while blue indicates protein decrease. (B) Pathway score changes due to lapatinib treatment in control and AKT-overexpressing BT474 cells. (C) Lapatinib dose–response for control and myrAKT BT474 cells. Error bars are SD for three replicate wells and results are representative of three biological replicates. (D) Lapatinib AUC values were quantified and compared between the control and AKT-overexpressing BT474 cells. Error bars represent SEM from three biological replicates.

