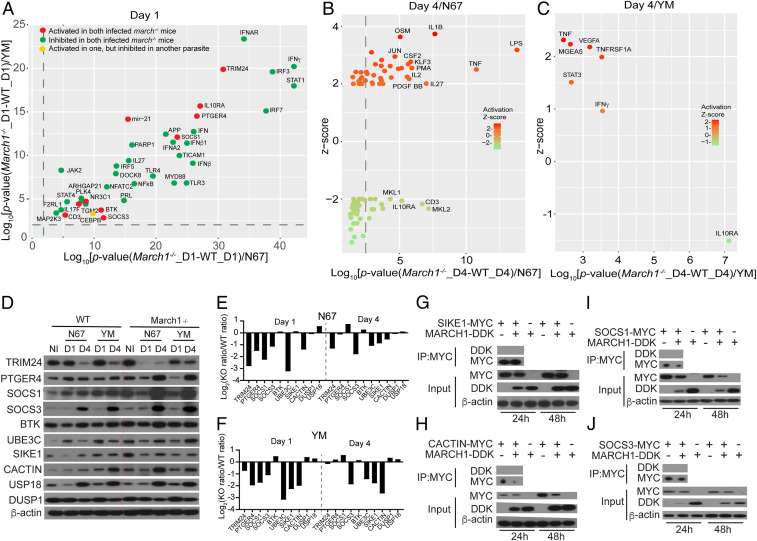
Fig. 4.
Activated and inhibited upstream regulators in March1−/− mice after infection with N67 or YM parasites. (A–C) mRNAs from spleens of uninfected and day 1 and day 4 infected WT and March1−/− mice were hybridized to Illumina mouse microarray and data were analyzed using IPA. (A) Correlation plots of log10 (P values) of common genes significantly activated (red dots; P < 0.05 and z scores ≥ 2.0) or inhibited (green dots; P < 0.05 and z scores ≤ −2.0) in infected March1−/− mice (compared with those of WT mice) day 1 pi with N67 or YM parasites. (B) Plot of upstream regulators significantly activated (z scores ≥ 2.0) or inhibited (z scores ≤ 2.0) day 4 pi with N67 parasite. (C) The same plot as in B for YM-infected mice. (D) Western blots of proteins from spleens of uninfected or day 1 or day 4 infected WT or March1−/− mice. Total-tissue lysates were separated on sodium dodecyl sulfate/polyacrylamide gels and detected using specific antibodies after blotting onto nitrocellulose membrane. Antibodies against host proteins are as indicated (Left). β-Actin was used as protein loading control. (E and F) Plots of ratios of scanned protein signals from March1−/− mice over those of WT mice in D after adjusting for protein levels from uninfected mice as in Fig. 3C. (G–J) Western blots of immunoprecipitated proteins (Top two panels) and total protein expression (Bottom three panels) from 293T cells transfected with plasmids containing genes encoding SIKE1 (G), CACTIN (H), SOCS1 (I), or SOCS3 (J), with or without March1. Antibodies used to pull down and to detect tagged protein expression are as labeled.

