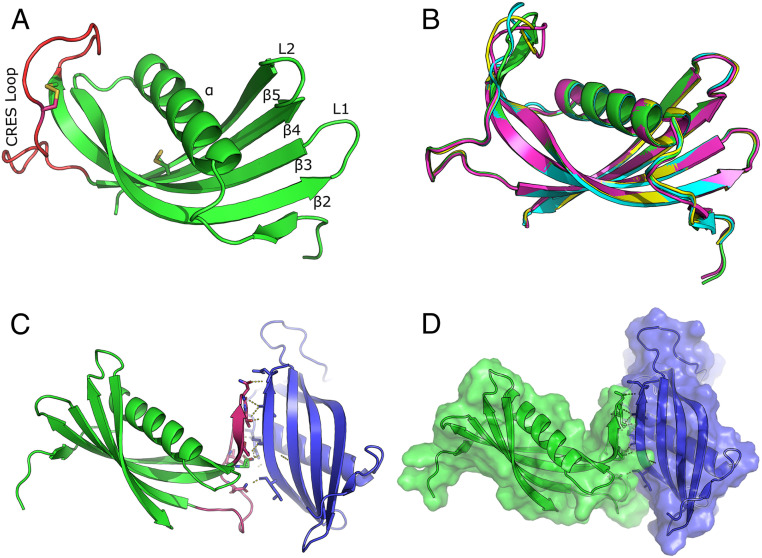
Fig. 1.
X-ray crystal structure of CRES. (A) Ribbon diagram of the CRES monomer highlighting the CRES loop in red and the two disulfide bonds as yellow sticks. (B) Superposition of the four CRES molecules in the crystallographic asymmetric unit (PDB code 6UIO) (55). (C) Intermolecular interaction of two CRES molecules in the crystallographic asymmetric unit. Highlighted in pink is the CRES loop and β3 of one molecule forming a parallel β-sheet interaction with β5 of an adjacent molecule. (D) Space-filling model of the two interacting CRES molecules.

