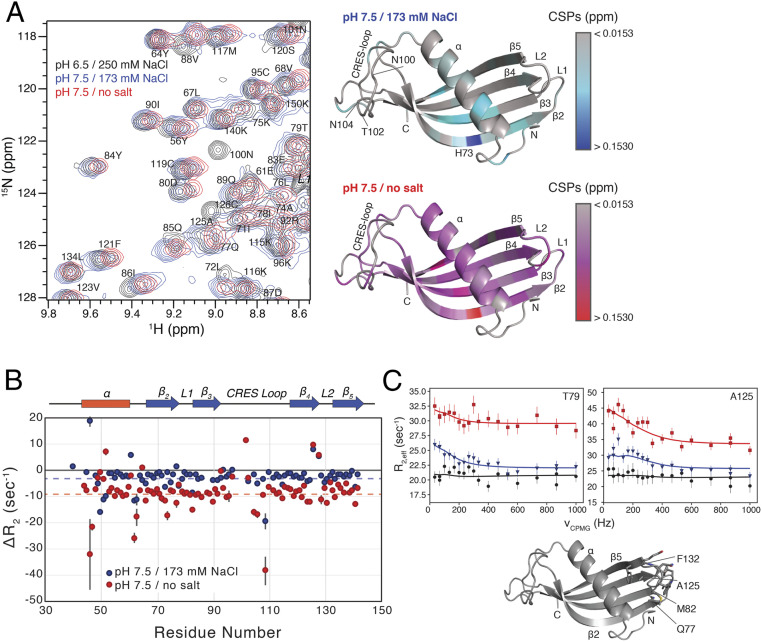
Fig. 3.
Changes in the structure and dynamics of CRES upon amyloidogenesis. (A, Left) Overlay of a region from the 2D 15N,1H HSQC spectra of 1.4 mM CRES at pH 6/250 mM NaCl (black contours), pH 7.5/173 mM NaCl (blue contours), and pH 7.5/0 mM NaCl (red contours). (A, Right) Calculated CSPs mapped onto the crystal structure of CRES. The CSPs between pH 6/250 mM NaCl and pH 7.5/173 mM NaCl are given as a gray-to-blue gradient, and the CSPs between pH 6/250 mM NaCl and pH 7.5/0 mM NaCl are given as a gray-to-red gradient. (B) Plot of the ΔR2 versus residue number. Blue points are the differences between pH 6/250 mM NaCl and pH 7.5/173 mM NaCl, and the red points are the differences between pH 6/250 mM NaCl and pH 7.5/0 mM NaCl. The error in the values, propagated from the covariance matrix of the fits, are shown as gray bars. The blue and red dashed lines highlight the average difference in ΔR2 for the two conditions. (C) Representative relaxation dispersion CPMG profiles are shown for CRES at pH 6/250 mM NaCl (black circles), pH 7.5/173 mM NaCl (blue triangles), and pH 7.5/0 mM NaCl (red squares) collected at 600 MHz and 25 °C. Error bars are derived from duplicate measurements of R2,eff at two CPMG fields. Solid lines are fit to the Bloch-McConnell equations describing two-site exchange. Below the plots, the residues for which chemical exchange phenomenon are observed are shown as sticks on the crystal structure.

