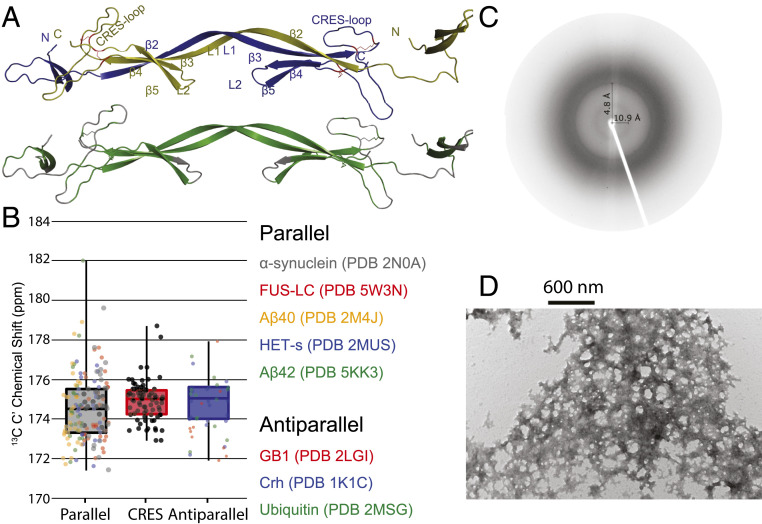
Fig. 6.
Structural model of the CRES amyloid and X-ray diffraction and TEM images of advanced CRES amyloid matrix formed by the ssNMR sample. (A) Domain-swapped structures with monomeric units colored in blue and yellow (Top) and regions predicted to form β-sheets shaded in green (Bottom). Numbering of secondary structure is based on Fig. 1. (B) Comparison of average and SD of 13C′ chemical shifts measured in advanced CRES amyloid compared to average and SD of well-defined parallel and antiparallel sheet structures. The dark horizontal line in each box signifies the average, the box signifies the 68% percent confidence interval, and the vertical line is the full spread of values. Color-coded dots are actual values reported for different proteins listed on the Right. (C) X-ray fiber diffraction of CRES amyloid matrix. X‐ray fiber diffraction exhibited reflections at 4.8 Å and 10.9 Å, indicative of the spacing between β‐strands and β‐sheets, respectively. (D) Negative stain TEM image reveals a complicated web-like matrix formed by the CRES protein studied by ssNMR.

