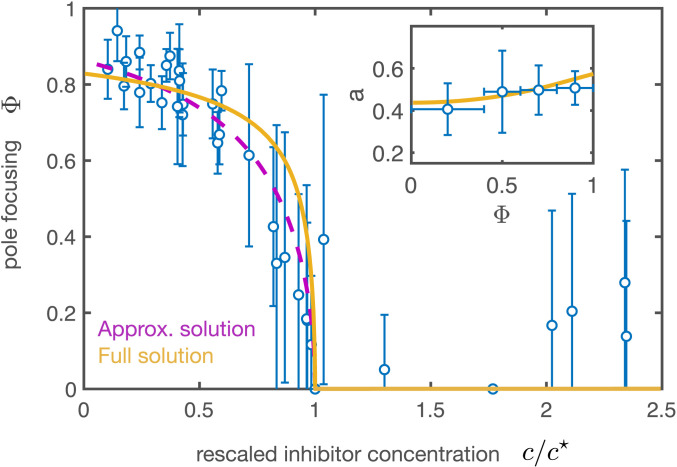
Fig. 3.
Bifurcation diagram under the titration of a dynein inhibitor. Pole focusing parameter as a function of the rescaled concentration of p150-CC1 inhibitor () with respect to the critical inhibitor concentration for the corresponding extract day. The circles correspond to the averaged experimental results using data from 10 different titrations during 7 different extract days ( spindles). Error bars indicate SD. The purple dashed curve and the yellow solid curve correspond to the dashed and solid curves in Fig. 1E, respectively, using , where is the dynein stress at zero inhibitor concentration. , and . The vertical error bars denote SD. (Inset) Aspect ratio a as a function of the pole focusing parameter (mean SD, spindles). The theoretical curve (yellow) stems from the constant volume condition and has no fitting parameters (SI Appendix). The parameters used for the theoretical curves are the same as in Fig. 1.

