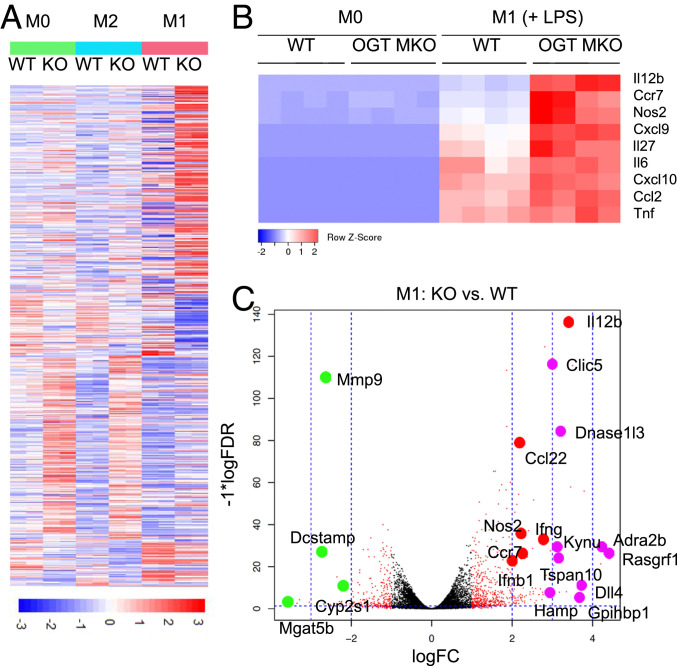
Fig. 6.
RNA sequencing analysis reveals a preferential regulation of macrophage M1 polarization by OGT. (A) Heat map showing the DEGs between WT and OGT KO BMDMs, where colors indicate counts per million values scaled by row (n = 4). (B) Heat maps of expression levels of M1 macrophage markers determined by RNA sequencing. (C) Volcano plot showing top DEGs between M1-polarized WT and OGT KO BMDMs. Red dot-labeled genes are up-regulated in OGT KO BMDMs and are closely related to M1 polarization. Purple and green dot-labeled genes have known functions related to M1 polarization and are up- and down-regulated in OGT KO BMDMs, respectively.

