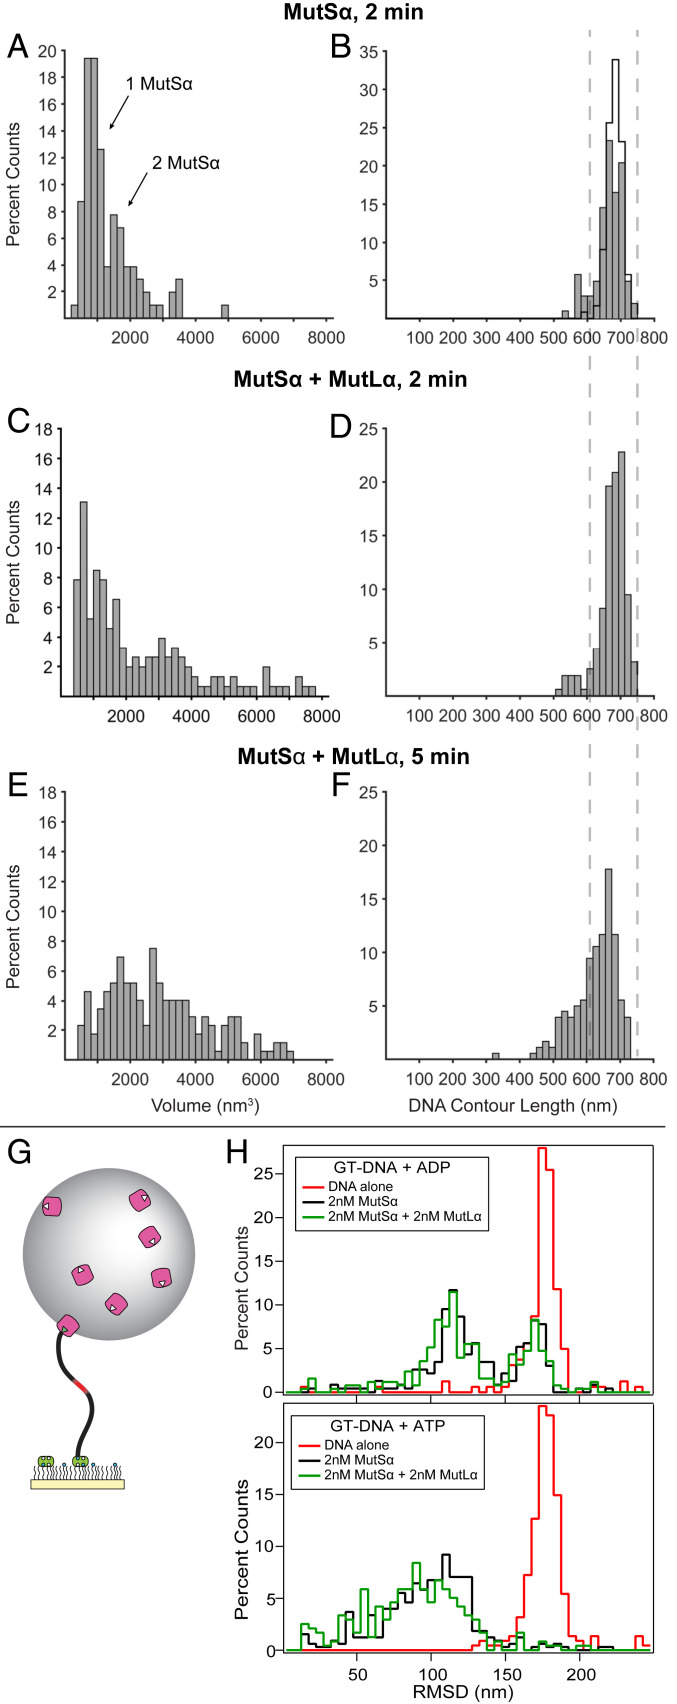
Fig. 3.
MutSα–MutLα complexes compact GT-DNA. (A–F) Distributions of AFM volumes (left column) and total DNA contour lengths (right column) for MutSα and MutSα–MutLα complexes bound to GT-DNA. Volumes (A, C, and E) and lengths (B, D, and F) of protein–DNA complexes for MutSα incubated in the presence of GT-DNA and ATP for 2 min (A and B; n = 103) and for MutSα+MutLα incubated in the presence of GT-DNA and ATP for 2 min (C and D; n = 199) and 5 min (E and F; n = 173). Both specific and nonspecific complexes are included in the analyses. Cityscape in B shows the length distribution for free DNA. Dashed lines across B, D, and F show ±1 SD of the measured free DNA length. Additional data using nicked plasmid GT-DNA as a substrate are included in SI Appendix, Figs. S2E and S5. (G) Cartoon of tethered particle motion assay showing mismatched DNA tethered to a surface with bead attached (not to scale). (H) Histograms of the RMSDs of many DNA molecules using the tethered particle motion assay with 550-bp GT-DNA. (Upper) Experiments with 2 mM ADP without protein (red; n = 161), with 2 nM MutSα (black; n = 231), and with 2 nM each of MutSα+MutLα (green; n = 252). (Lower) Experiments with 2 mM ATP without protein (red; n = 224), with 2 nM MutSα (black; n = 326), and with 2 nM each of MutSα+MutLα (green; n = 238). No significant changes in bead motion were observed with GC-DNA for either MutSα alone or MutSα and MutLα in the presence of ATP (SI Appendix, Fig. S6).

