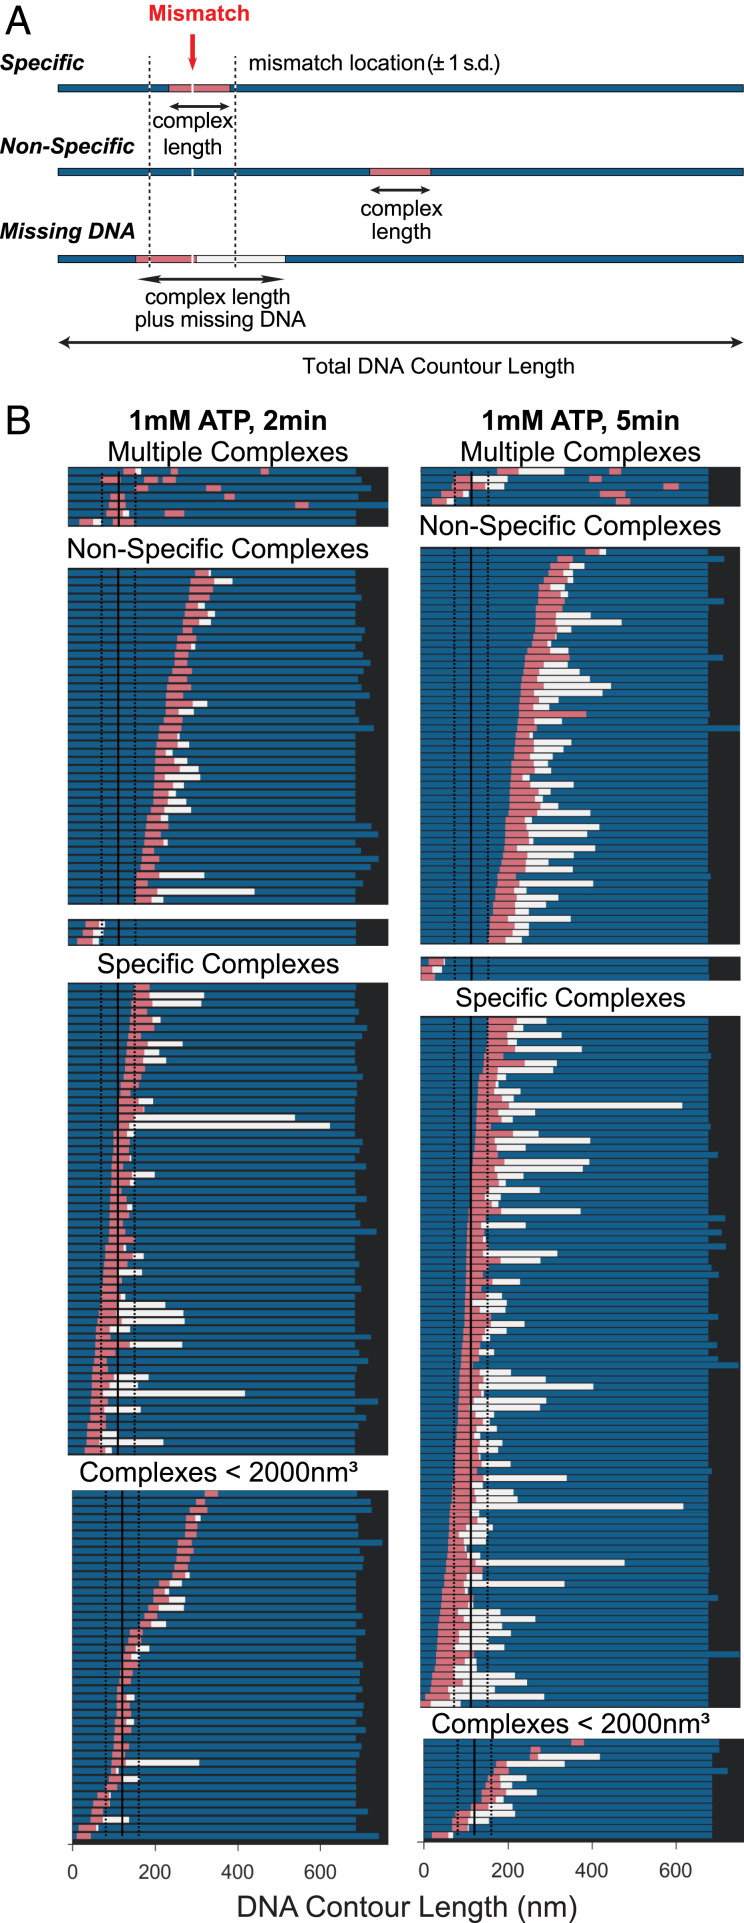
Fig. 4.
Position analysis of MutSα–MutLα complexes bound to GT-DNA. (A) Schematics of DNA molecules (represented as bars) showing location of MutSα–MutLα complex and extent of DNA contained within the complex. Schematics for three types of complexes are shown: specific, mismatch within complex (Top); nonspecific, complex away from the mismatch (Middle); and missing DNA, complexes where the DNA is shorter than ±1 SD of the distribution of DNA contour length (Bottom). For all, the bar denotes the total DNA contour length and the pink section is the length of the complex on the DNA. The blue sections represent the length of the DNA observed on either side of the complex. The white section (in missing DNA example) represents the missing DNA length for molecules with lengths less than 1 SD of free DNA. The total amount of DNA that the protein complex covers is the summation of the pink and white bars. On the top example, a red arrow points to the mismatch site, and dashed black lines on either side indicate ±1 SD of the measured position of the mismatch on the DNA. (B) Positions of MutSα–MutLα complexes on GT-DNA in the presence of 1 mM ATP incubated for 2 min (Left) or 5 min (Right). Complexes are first separated into two groups: complex volumes <2,000 nm3 consistent with one or two MutSα (Bottom) and >2,000 nm3 consistent with MutSα–MutLα complexes (Upper). Those complexes with volumes >2,000 nm3 (SL complexes) are separated into specific and nonspecific complexes. Each group is sorted from top to bottom based on the position of the complex relative to the nearest end to the mismatch, and those with multiple complexes are shown on the top. DNA is only considered to be compacted if the contour length is shorter than the 1 SD in the length measurements. These plots are generated from the same data as in Fig. 3 C–F.

