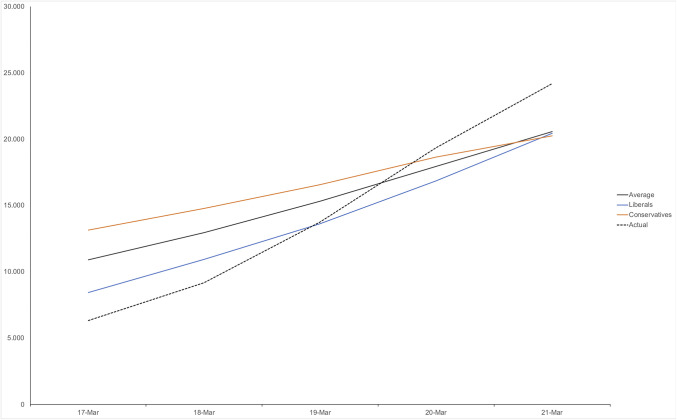
Fig. 1.
Study 1: Participants, on average, show exponential growth bias and underestimate the slope of the coronavirus growth curve over the past week, falsely believing the number to be higher early in the week than it was (gray, dashed line shows actual total number). Conservatives (red) do so more strongly than liberals (blue) (continuous data split across the neutral midpoint, for presentation purposes).

