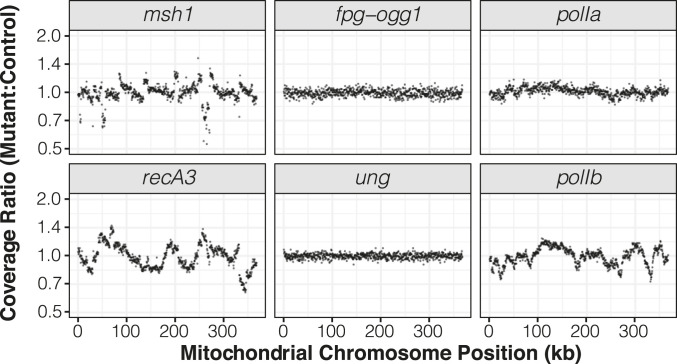
Fig. 3.
Sequencing coverage variation across the mitochondrial genome in mutants relative to their matched wild-type controls. Each panel represents an average of three biological replicates. The reported ratios are based on counts per million mapped reads in 500-bp windows. The msh1 mutant line reported in this figure is CS3246.

