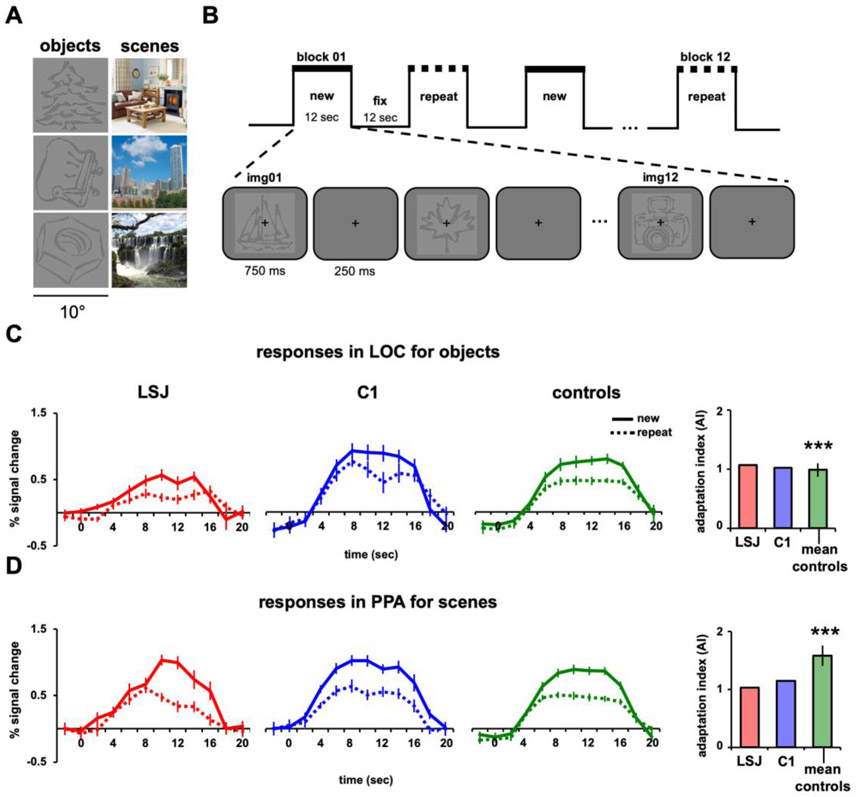
Figure 3. Block design and immediate repetition.
(A) Example line-drawing objects and scenes used as stimuli. (B) Blocks alternated between “new” (12 different stimuli) and “repeat” (1 stimulus repeated 12 times) conditions, with order counterbalanced across runs. Objects and scenes were shown in separate runs. BOLD time courses and AIs for LSJ (red), a representative control C1 (blue), and the average of all controls (green) for (C) objects in LOC and (D) scenes in PPA. The asterisks above the control average denote significant adaptation effects from zero using a one-sample t-test (*** p < 0.001). Error bars in the line graphs for LSJ and C1 denote standard errors across blocks of trials. The error bars for average controls (for this and subsequent figures) denote standard errors across subjects. Using the Crawford and Howell’s t-test for case-control comparisons (38), LSJ’s AIs did not reliably differ from control AIs for both LOC and PPA.

