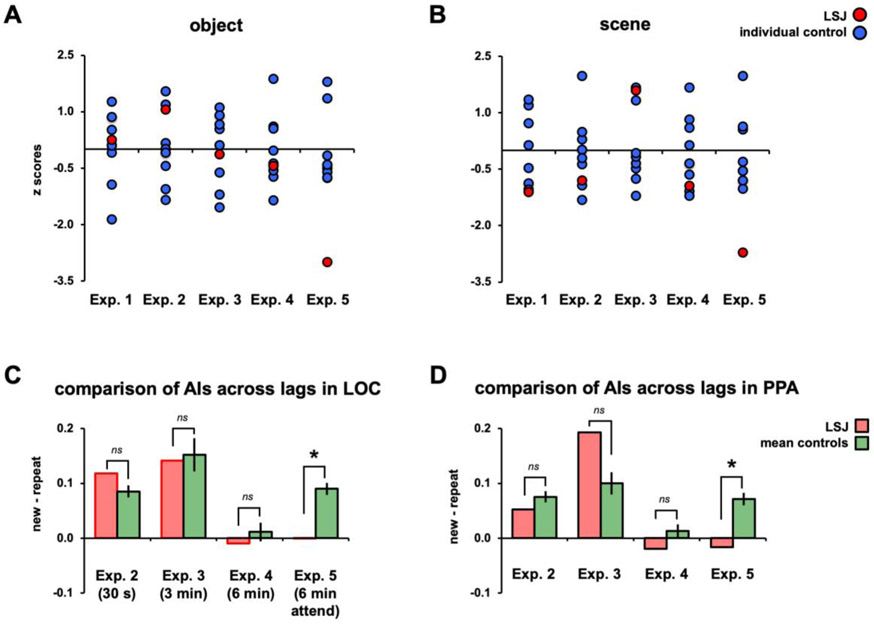
Figure 8. Summary across experiments.
Normalized (z-scores against mean and SD from controls) AIs from Experiments 1-5 are plotted for LSJ (in red) and individual controls (in blue) for objects (A) and scenes (B). For Experiments 1-4, LSJ’s AIs are within the distribution of controls’ AIs. In Experiment 5, for both object and scene, LSJ’s AI values are about 3 SDs below the mean of controls. Mean control AIs from Experiments 2-5 are re-plotted (in green) against LSJ’s AIs (in red) for objects in LOC (C) and scenes in PPA (D).

