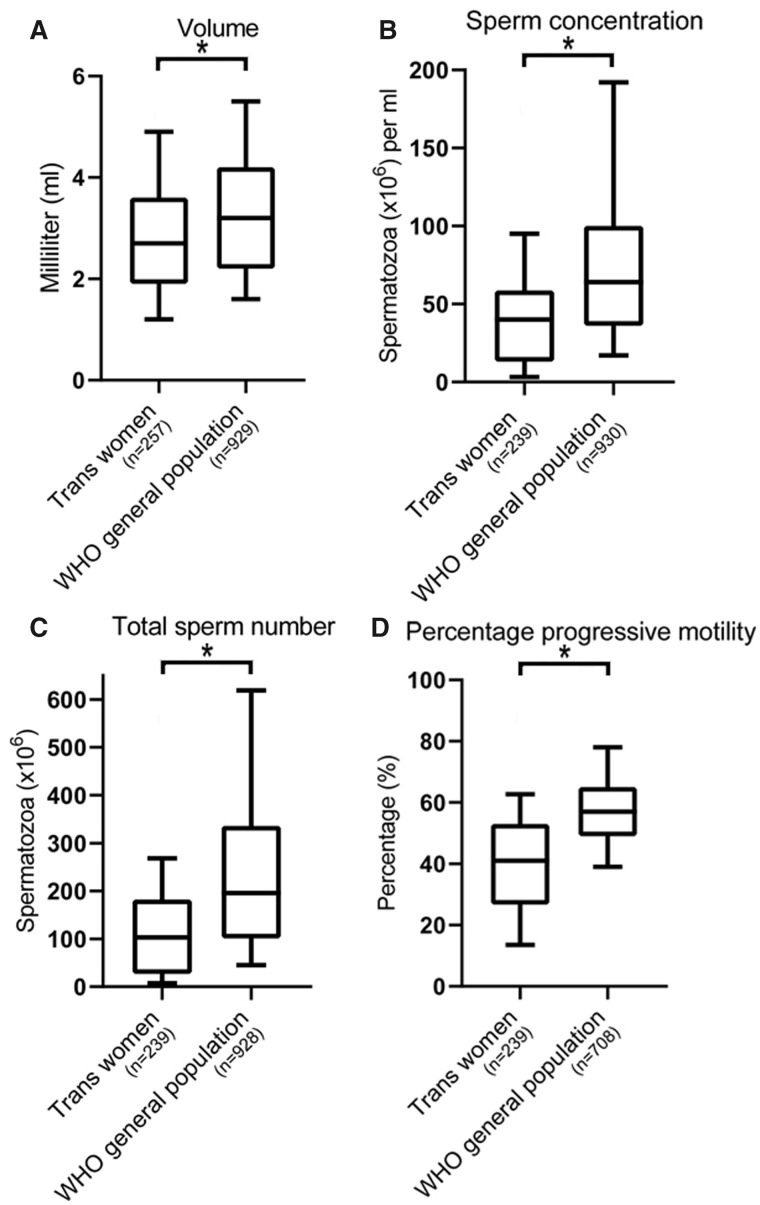
Figure 1.
Box and whisker plots of semen analysis data. The data are semen volume, sperm concentration, total sperm number and percentage progressive motility from trans women compared with World Health Organization (WHO) values for unscreened men from the general population. The boxes represent the quartiles and the lines within them are the medians; the whiskers extend from the 10th to the 90th centiles. *P-value <0.05 using Wilcoxon signed-rank tests, for (A) analysis was performed on the entire cohort, for (B–D) azoospermic trans women were excluded from analysis.

