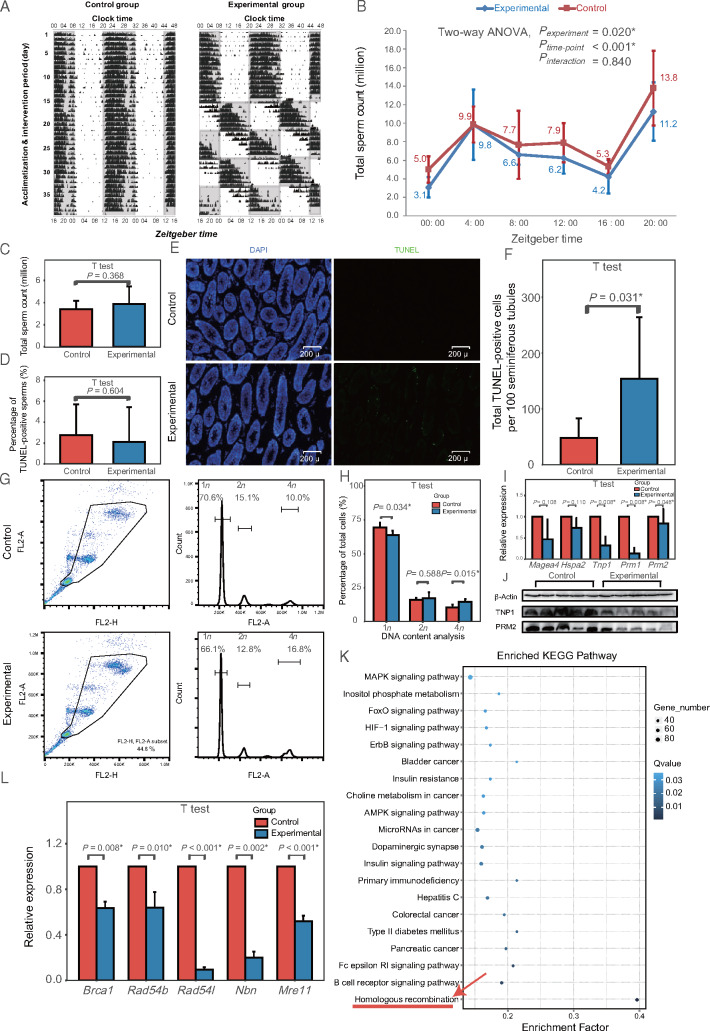
Figure 4.
Compromised spermatogenesis in a mouse model of circadian desynchrony. (A) Representative activity recorded by running wheel (double plot). Black bars indicate activity counts (in percentile) every 6 min. Gray squares represent darkness; white squares, light. (B) Comparison of total sperm count between experimental and control animals (n = 4–7 mice per group in each time point) at different zeitgeber time points. P-values are shown separately for group effect, time point effect and interaction of group and time point. (C) Comparison of total sperm count between control animals, maintained on a fixed light-dark cycle, and experimental animals after undergoing a 35-day recovery on the same light-dark cycle as control animals after the photoperiod shifting (n = 14 mice per group). (D) Comparison of apoptosis in epididymal sperm between experimental and control animals (n = 13 mice per group). (E) Representative photomicrographs comparing apoptosis in seminiferous tubules between experimental and control animals, using TUNEL staining of the testis. Apoptotic cells appear green. (F) Quantitation of assays shown in panel E (n = 8 mice per group). (G) Flow cytometric analysis of DNA content (1n, 2n or 4n) in cells in seminiferous tubules of experimental and control mice. (H) Quantitation of assays shown in panel G (n = 5 mice per group). (I) Real-time PCR analysis of spermatogenic stage markers differentially expressed in experimental animals (n = 7 mice per group). (J) Representative western blotting of markers of round/condensing spermatids (TNP1) and elongated/condensed spermatids and luminal sperm (PRM2) differentially expressed in experimental animals. (K) Pathway enrichment analysis of mRNAs differentially expressed in experimental mice testis, based on the Kyoto Encyclopedia of Genes and Genomes (KEGG) (n = 14 mice per group). Homologous recombination (red arrow) pathway shows the greatest enrichment. (L) Real-time PCR validation of homologous recombination genes differentially expressed in experimental animals (n = 7 mice per group). *P < 0.05.

