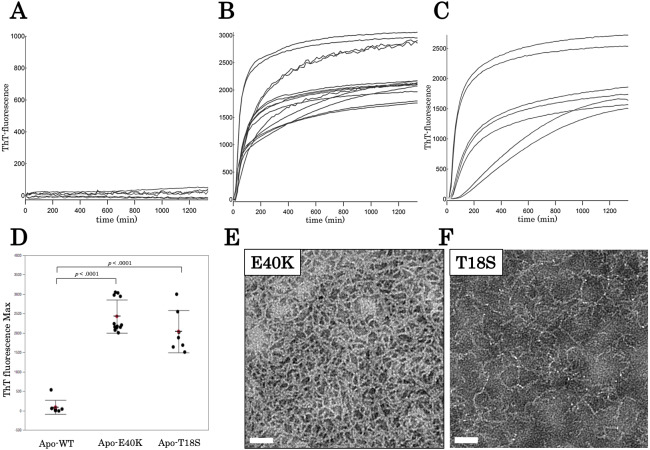
Figure 3. Time dependent thioflavin T assay and electron micrographs of canine SOD1 fibrils.
(A–C) Time courses of aggregation of WT, E40K, and T18S canine SOD1 in the Cu2+/Zn2+—unbound state. (D) The maximum of ThT fluorescence derived from Figs. 3A–3C. Both the E40K and T18S mutations significantly increased the ThT fluorescence (p < 0.001). (E and F) Negatively stained electron microscopy images of SOD1 E40K (E) and SOD1 T18S (F). Thin, curved, and fibrous aggregates were observed. Scale bar = 100 nm.

