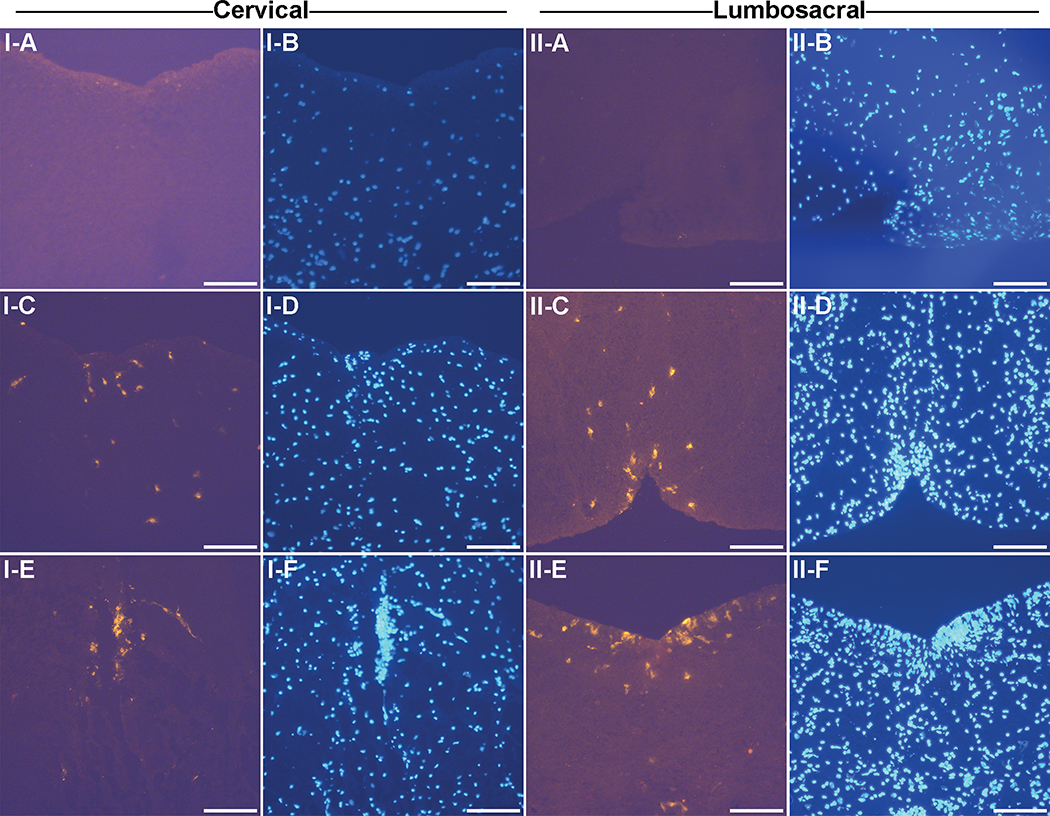
Fig. 4. CD4+ T cell staining in the cervical region and lumbosacral region of the spinal cord.
Frozen sections of the spinal cord from both control and EAE mice from the cervical region of the spinal cord were stained with the CD4 antibody and DAPI nuclear stain. A representative CD4+ stained T cell is indicated by the arrowhead. All images were taken at under a 20X objective. Bar represents 100 microns in length. I-A and I-B, Saline cervical; I-C and I-D, EAE cervical at the ventral median fissure; I-E and I-F, EAE cervical at the central canal; II-A and II-B, Saline lumbosacral; II-C and II-D, EAE lumbosacral at the dorsal median sulci; G and H, EAE lumbosacral at the dorsal median sulci; K and L, EAE lumbosacral at the ventral median fissure. Results are representative of 4 mice.

