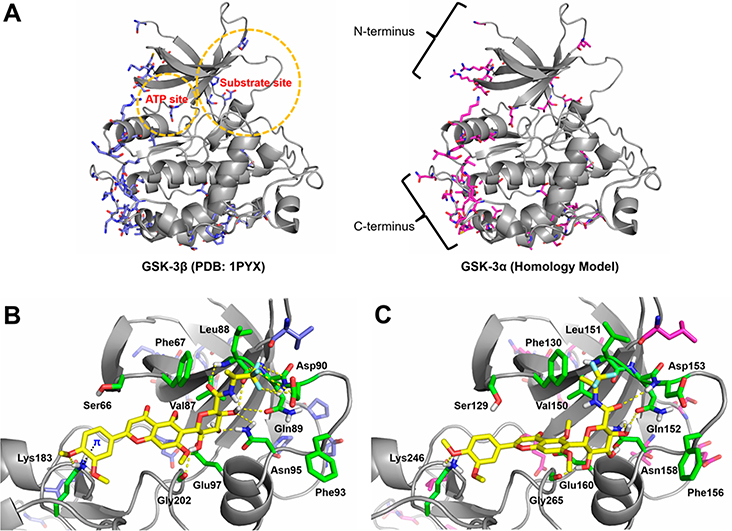
Figure 7.
Molecular models of GSK-3β and GSK-3α and the docking complexes with 30. (A) Superposition of GSK-3β structure (PDB code 1PYX) and GSK-3α homology model (UniProt code P49840). The ATP and substrate sites are highlighted in circles, and the N- and C-termini are depicted. The ATP and substrate sites of GSK-3α/β isoforms are highly conserved and most of amino acid differences occur in the N- and C-terminal regions. (B) Predicted docking pose of 30 into the substrate site of GSK-3β structure. (C) Predicted docking pose of 30 into the substrate site of GSK-3α homology model. GSK-3 isoforms are shown as gray cartoons. In both isoforms, selected conserved residues are displayed as green sticks. In GSK-3β, nonconserved residues are displayed as blue sticks. In GSK-3α, nonconserved residues are displayed as magenta sticks. The dotted lines represent key molecular interactions.

