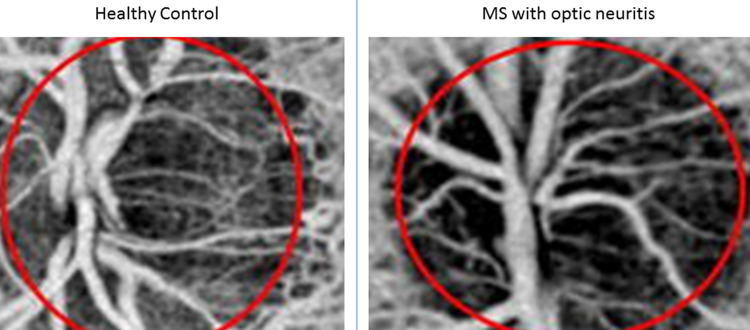
Figure 1.
Left Side: Disc OCT-A of a healthy control subject. Right side: Disc OCT-A of an optic neuritis disc showing reduced density of the optic nerve head blood vessel network. This implies reduced blood flow on the optic nerve head.
Notes: Red solid lines indicate the ONH area that was used for the relevant flow index calculations. Copyright © 2014. BMJ Publishing Group Limited. Modified from Wang X, Jia Y, Spain R, et al. Optical coherence tomography angiography of optic nerve head and parafovea in multiple sclerosis. Br J Ophthalmol. 2014;98:1368–1373.17

