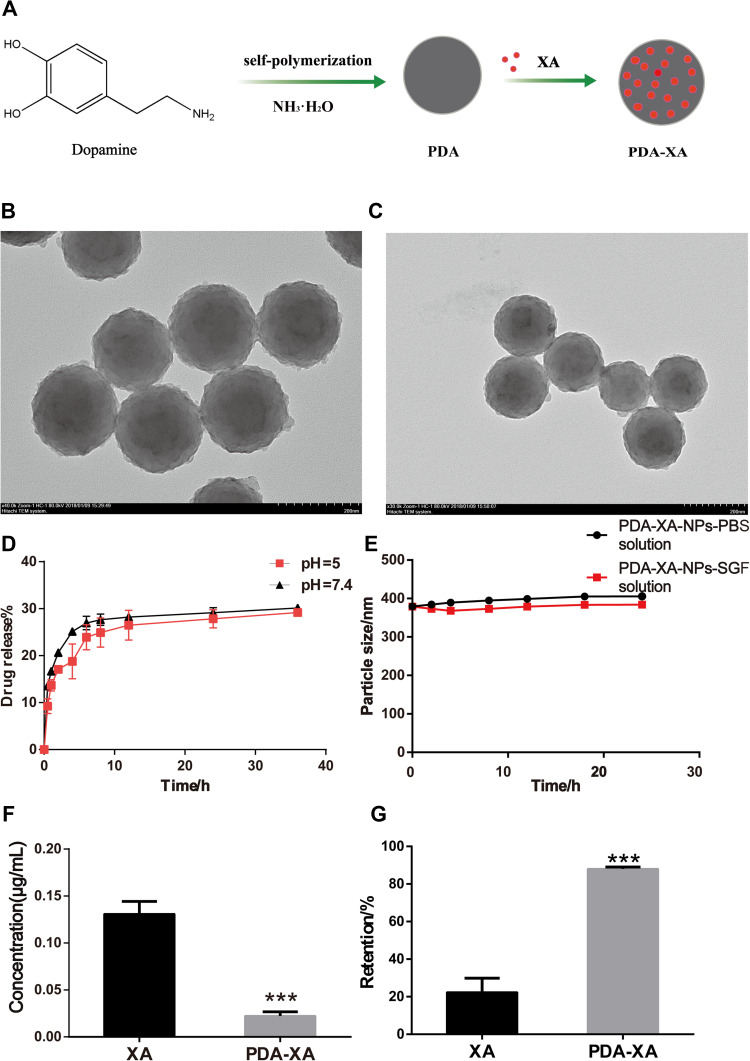
Figure 1.
(A) Schematic diagram of synthetic process of PDA-XA-NPs. (B) TEM image of PDA-XA-NPs. (C) TEM image of PDA. (D) In vitro release of PDA-XA-NPs in PBS at different pH values. (E) Stability of PDA-XA-NPs in PBS and SGF. (F) Protein contents in supernatant of XA and PDA-XA-NPs (***P < 0.001 vs XA). (G) Gastric mucosal retentions of XA and PDA-XA (***P < 0.001 vs XA).

