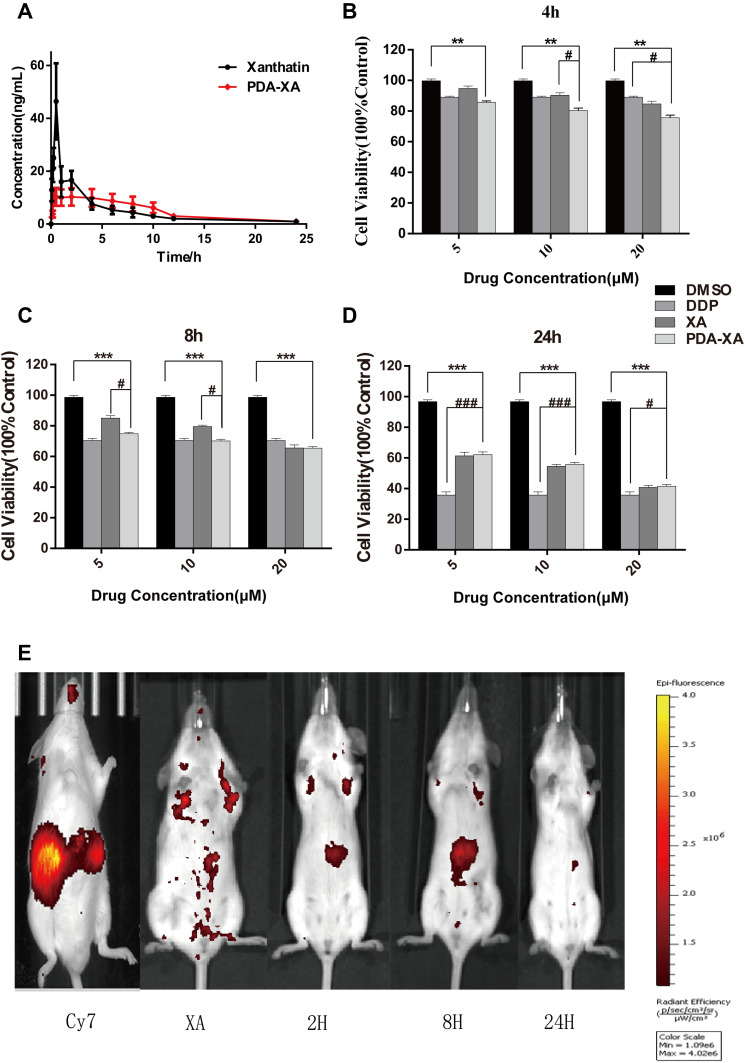
Figure 4.
Plasma concentration of XA vs time curves after intragastric administration with XA and PDA-XA-NPs. (B–D) Viability of MKN-45 cells after treatment with XA, PDA-XA-NPs, DDP and DMSO. Incubation for 4 h (B); 8 h (C); 24 h (D). Data are represented as mean ± SD (n=6; vs DMSO **P < 0.01, ***P < 0.001, vs DDP #P < 0.05, ###P < 0.001). (E) Imaging atlas of mice in vivo.

