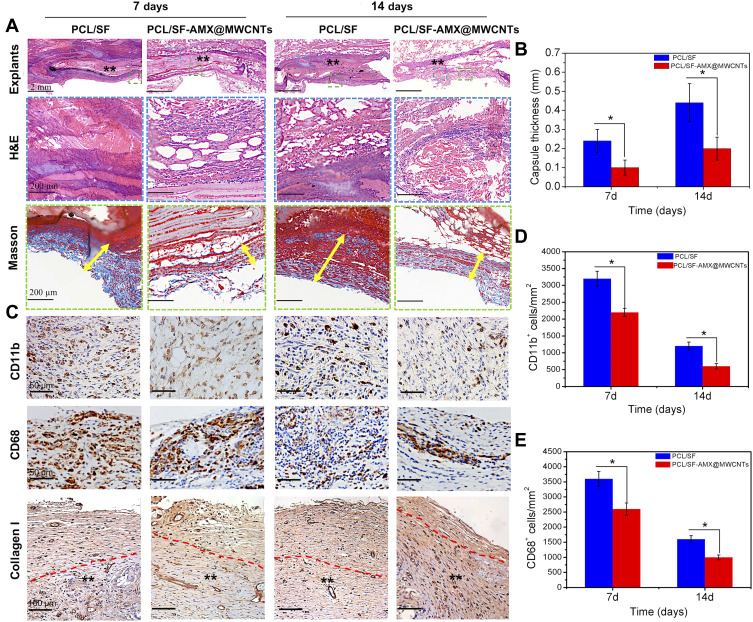
Figure 7.
Histological analysis of PCL/SF mesh and PCL/SF–AMX@MWCNT mesh after their subcutaneous implantation in rats for 7 or 14 days (A). The scale bars in the explants, H&E and Masson rows of images indicate 2 mm, 200 μm and 200 μm. ** indicated meshes, and the yellow arrowed lines marked the capsule thickness in (A); The quantitative thickness of fibrous capsules (B); CD11b, CD68 and collagen I immunohistochemical staining (C); CD11b, CD68 and collagen I rows of images indicate 50 μm, 50 μm and 100 μm, respectively. **indicated meshes, and the red dotted lines marked the border between mesh and collagen deposition in (C); The quantification of CD11b (D) and CD68 (E) positive cells in the staining. *P < 0.05 in (B) and (D and E).

