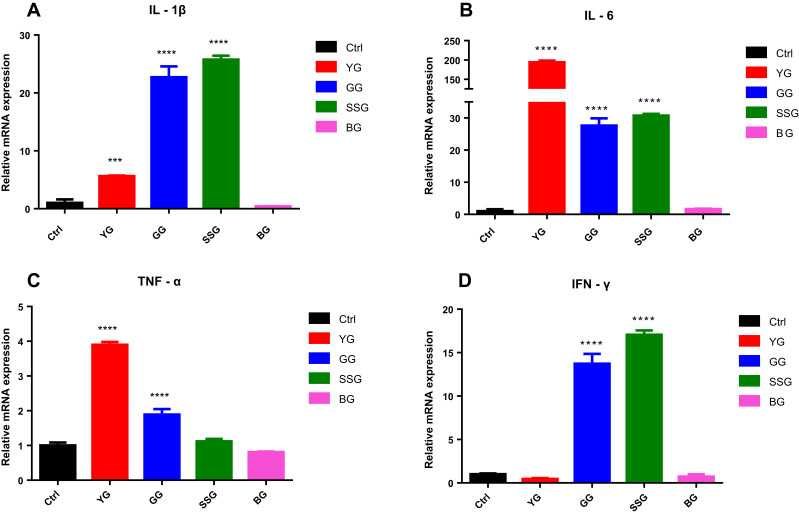
Figure 2.
Effects of YG, GG, SSG, BG NCs on the expression of IL-1β, IL-6, TNF-α, IFN-γ in RAW264.7 macrophages. Cells were cultured in the presence of NCs (400 μg/mL) for 24 h and the expression of IL-1β (A), IL-6 (B), TNF-α (C), IFN-γ (D) mRNAs was measured using RT-PCR. Relative increases in the levels of each band compared with the loading control β-actin. Values are expressed as the mean ± SEM of the three separate experiments. Each group compared with the NCs-untreated cells (0 μg/mL). ***p < 0.001, ****p < 0.0001.

