Fig. 3.
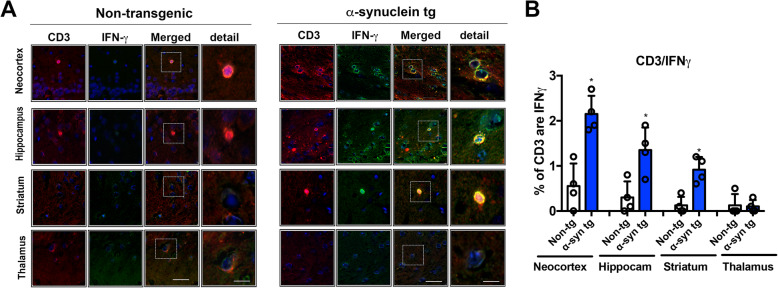
Double immunohistochemical analysis of T cells in the brains of ⍺-synuclein transgenic mice. a Split and merged representative laser scanning confocal microscopy images from the neocortex, hippocampus, striatum, and thalamus of non-tg and ⍺-syn tg mice double labeled with antibodies against CD3 (red channel) and IFNγ (FITC channel), co-localizing CD3 and IFN-γ (merged images, yellow) suggest representing of NKT cells. As shown, ⍺-syn Tg mouse shows more CD3 positive cells and some of them are also IFN-γ positive which represents NKT cells. In contrast, there are almost no IFN-γ positive cells in non-Tg mouse brain. b Computer-based image analysis showing significant increase in the % of CD3/ IFN-γ positive cell numbers in neocortex, hippocampus, and striatum of ⍺-syn tg mice. Scale bars = 10 μm (low magnification) and 5 μm (high magnification). Non-tg and α-syn tg mice (n = 4). Statistical significance determined by unpaired t test; *p ≤ 0.05

