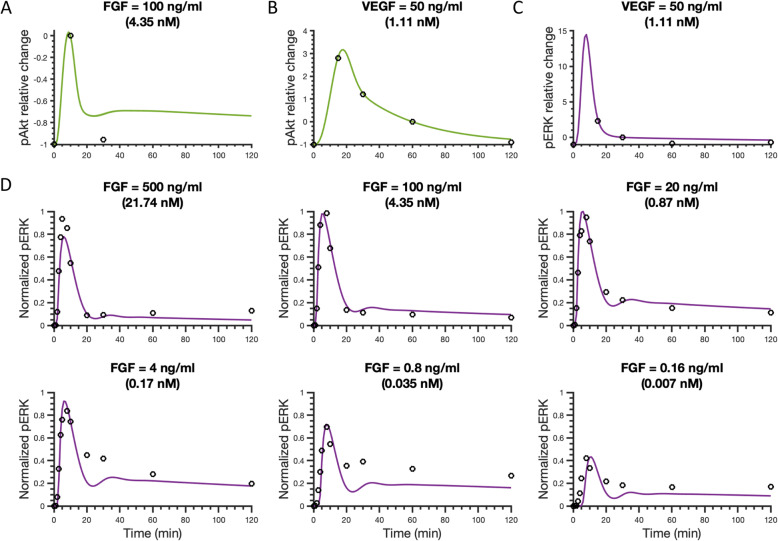
Fig. 2.
Model comparison to training data for FGF or VEGF stimulation. a Relative change of pAkt for 100 ng/ml (4.35 nM) FGF stimulation compared with the reference time point (10 min). b Relative change of Akt phosphorylation upon stimulation with 50 ng/ml (1.11 nM) VEGF compared with reference time point (60 min). c Relative change of ERK phosphorylation following stimulation with 50 ng/ml (1.11 nM) VEGF compared to the pERK level at a reference time point (30 min). d Normalized pERK dynamics in response to FGF concentrations ranging from 0.16 to 500 ng/ml (0.007–21.74 nM), where pERK level was normalized by the maximum pERK stimulated by FGF across all six concentrations in 2 hours. Circles in Panels A-C are experimental data from HUVECs, and circles in Panel D are experimental data from the NCI-H1730 cell line. Curves are the mean model predictions of the 15 best fits. Shaded regions show standard deviation of the fits

