
Figure 5. VHL increases the activation of p53 under hypoxia leading to increased transcription and secretion of TSP-1.
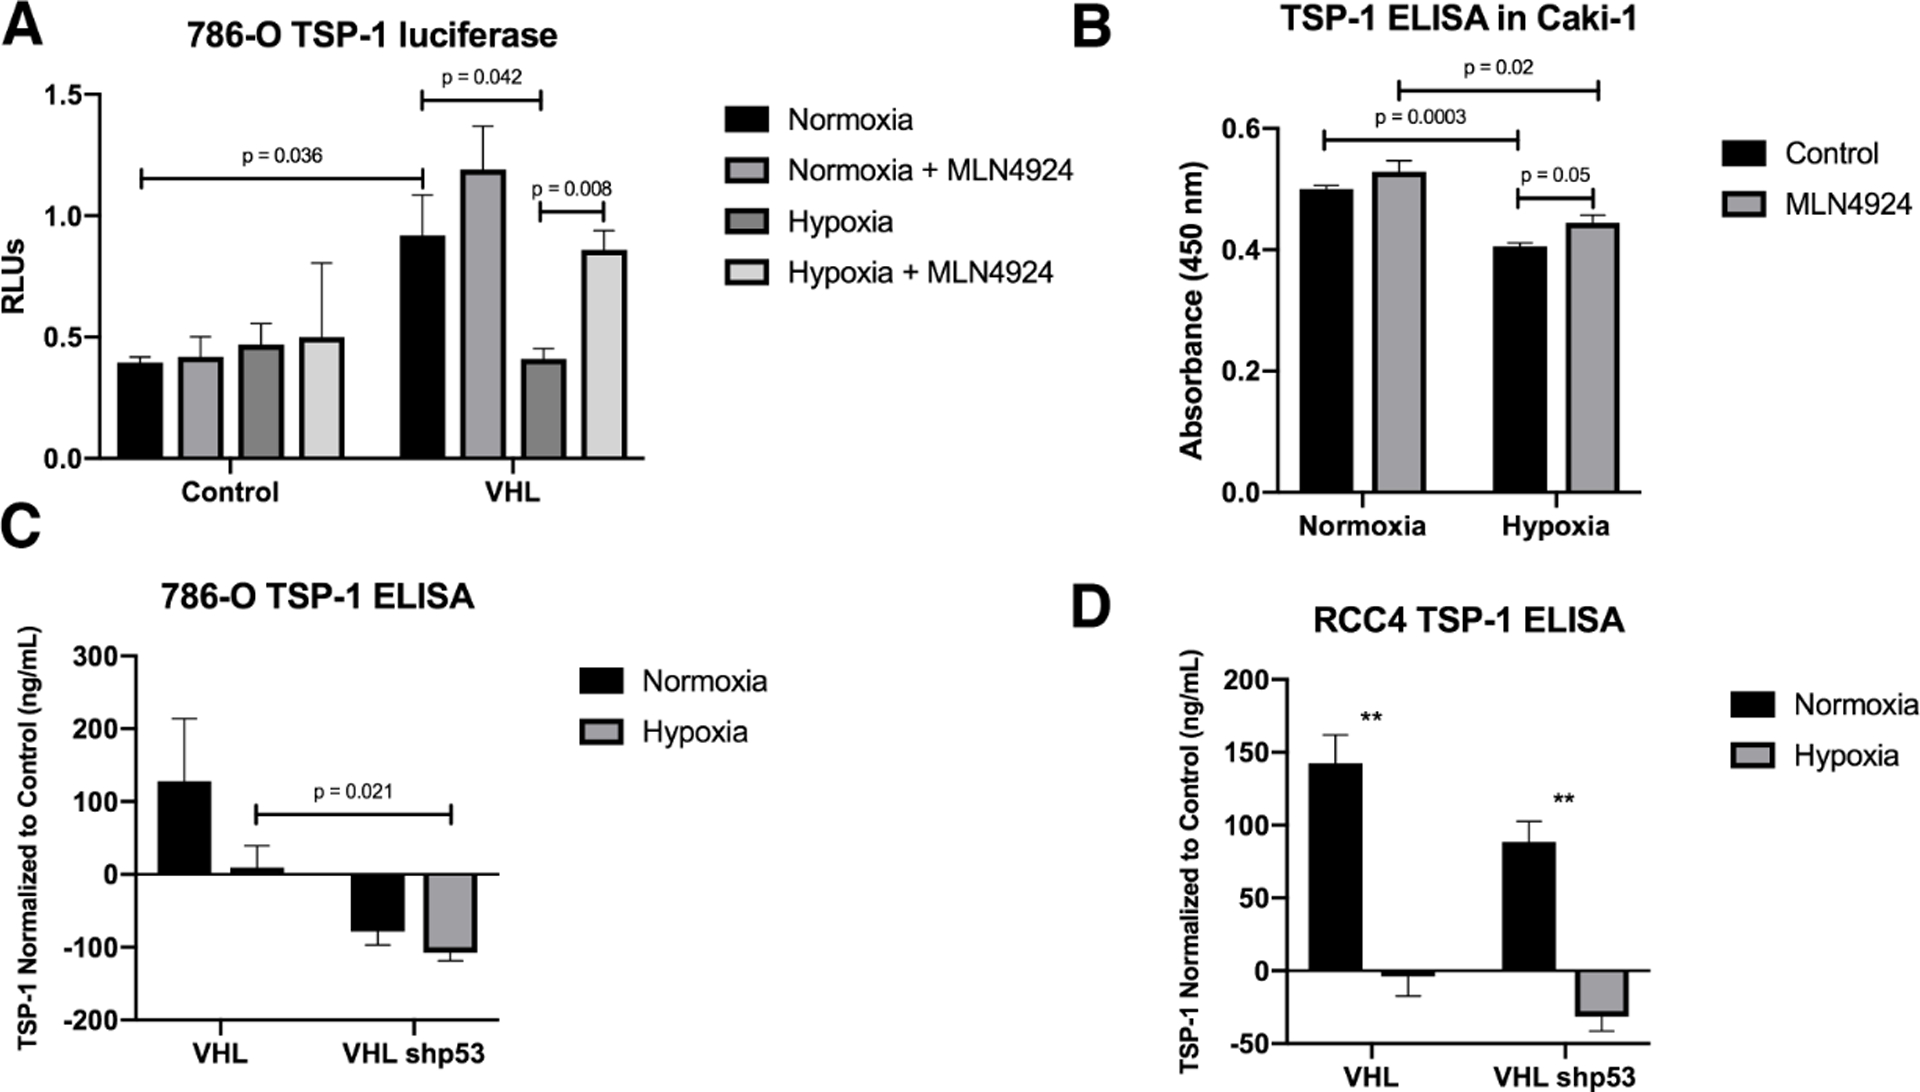
(A) Luciferase assay for thrombospondin-1 in 786-O cells treated with MLN4924 and subjected to hypoxia. Means are plotted as relative luciferase units and calculated from three biological replicates. Error bars represent SEM. Statistics were calculated using an unpaired t test.
(B) Enzyme-linked immunosorbent assay for TSP-1 using a 10% dilution of conditioned media from Caki-1 cells treated with MLN4924 under hypoxia. Means from three biological replicates are plotted. Error bars represent SEM. Statistics were calculated using an unpaired t test.
(C-D) Enzyme-linked immunosorbent assay for TSP-1 using a 10% dilution of conditioned media from 786-O (C) or RCC4 (D) cells with knockdown p53 under hypoxia. Means from three biological replicates are plotted. Error bars represent SEM. Statistics were calculated using an unpaired t test (*p<0.05, **p<0.01, ***p<0.001).