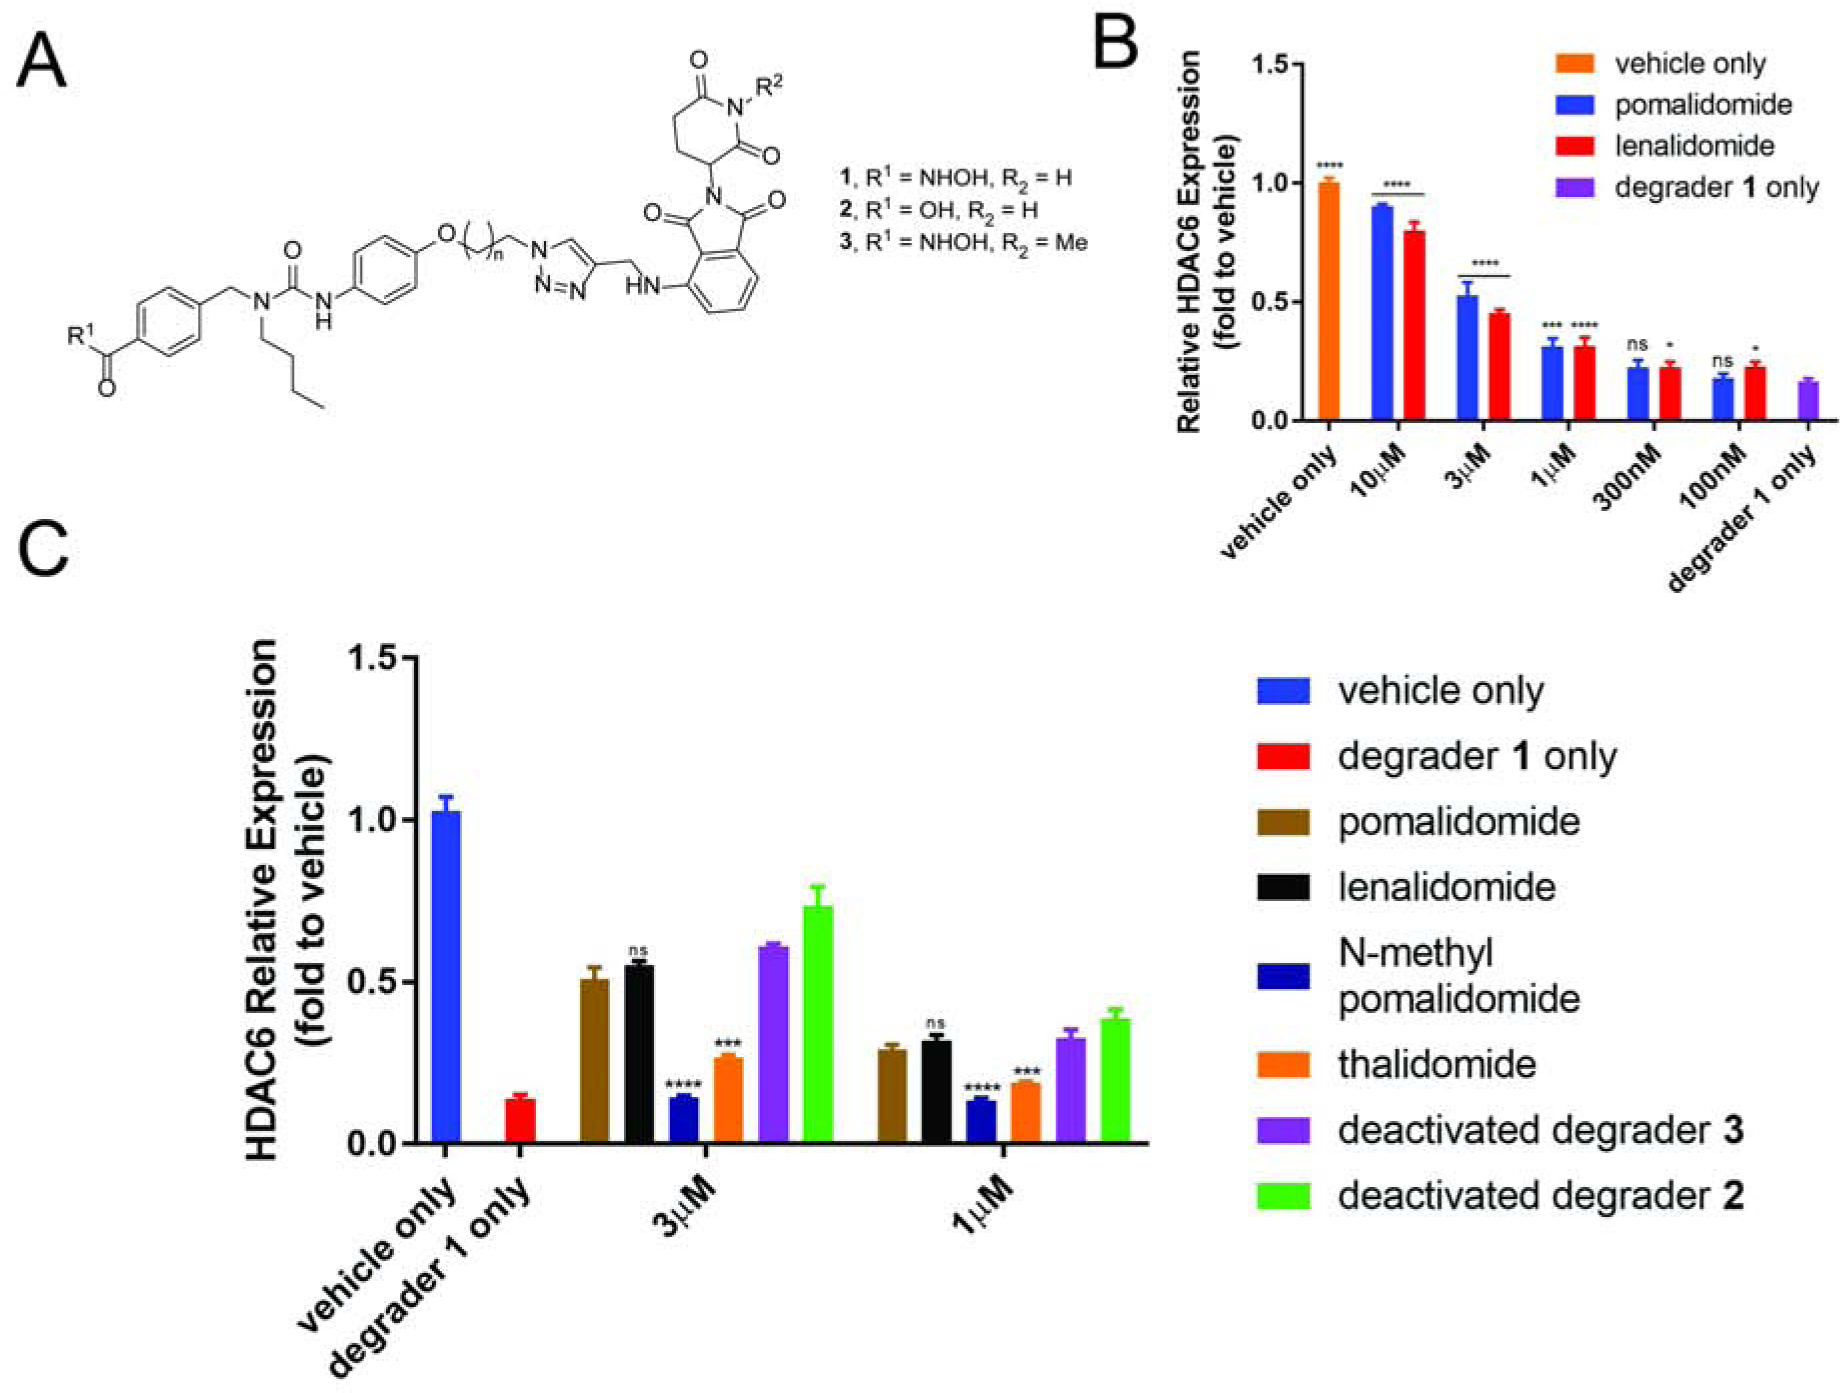
Figure 2. Proof-of-principle Study.

(A) Chemical structures of HDAC6 degrader 1 and deactivated degraders 2 and 3. (B) Assay optimization. (C) Proof-of-concept study. MM1S cells were treated with CRBN ligand or vehicle (1 h), then degrader or vehicle (5 h) and analyzed by in-cell ELISA. See also Figure S1. Bar graphs were generated as means of HDAC6 relative expression (n = 3) with ± SD as the error bar. Variances were analyzed by one-way ANOVA and multiple group comparison with “degrader 1 only” group (B) or unpaired two-tail student t-test in comparison with “pomalidomide” group (C). Not significant (ns) P > 0.05, *P ≤ 0.05, ***P ≤ 0.001, ****P ≤ 0.0001.
