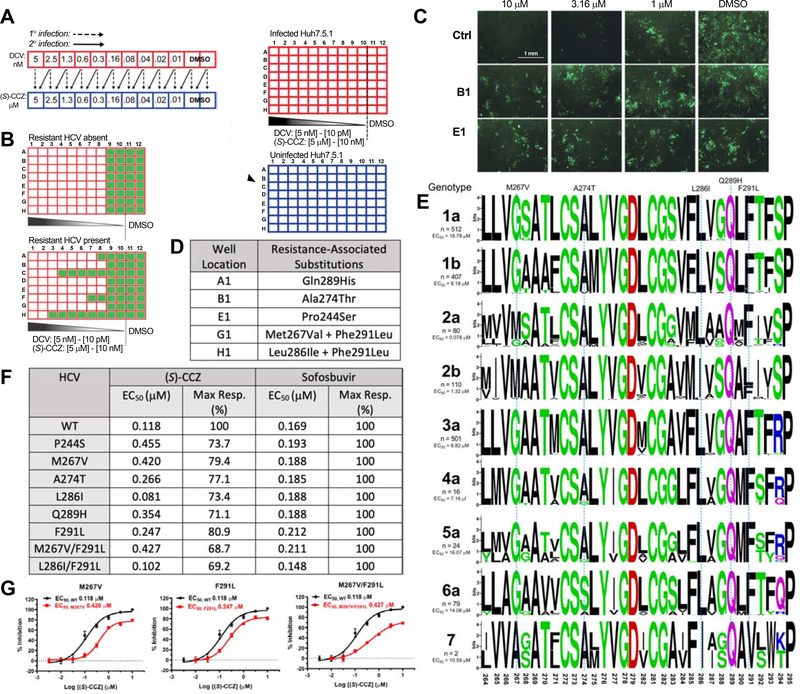
Figure 1. Generation of (S)-CCZ resistance-associated substitutions (RASs) of HCV.
A. Two-part HCV infection assay to generate drug-resistant HCV. Red: infected plate; blue: uninfected plate. Drug concentrations correspond to (S)-CCZ in [μM] and daclatasvir in [nM]. B. Expected results from HCV core immunofluorescent staining before and after generating drug-resistant HCV strains. C. HCV core immunofluorescent staining for CCZ-resistant HCV strains generated above that were treated with various concentrations (S)-CCZ. Two representative (S)-CCZ-treated HCV clones (B1 and E1) and one DMSO-treated HCV clone are shown. Detailed passage data are shown in Figure S1A. D. Mutations of putative HCV RASs were identified from each individual well of the 96-well plates at passage 13. E. Sequence alignment for the putative fusion peptide (aa 264–294) in HCV E1 for each HCV genotype (genotypes 1–6 were obtained from the Virus Pathogen Resource database and genotype 7 from the NCBI). MAFFT version 7 with the G-INS-1 progressive method and Berkeley WebLogo were used to generate the alignment figure. The amino acid substitutions of the (S)-CCZ RASs are listed above the alignment. The n represents the number of HCV sequences for each genotype used for the alignment. EC50 of (S)-CCZ for each HCV genotype was shown to the left in the chimeric HCV genotype assay (complete data presented in Figure S5). F. Summary of EC50 and maximal response of HCV-WT and HCV E1 mutants against (S)-CCZ and sofosbuvir. G. (S)-CCZ dose-response curves of 3 representative HCV E1 mutants. Complete data are presented in Figure S2.

