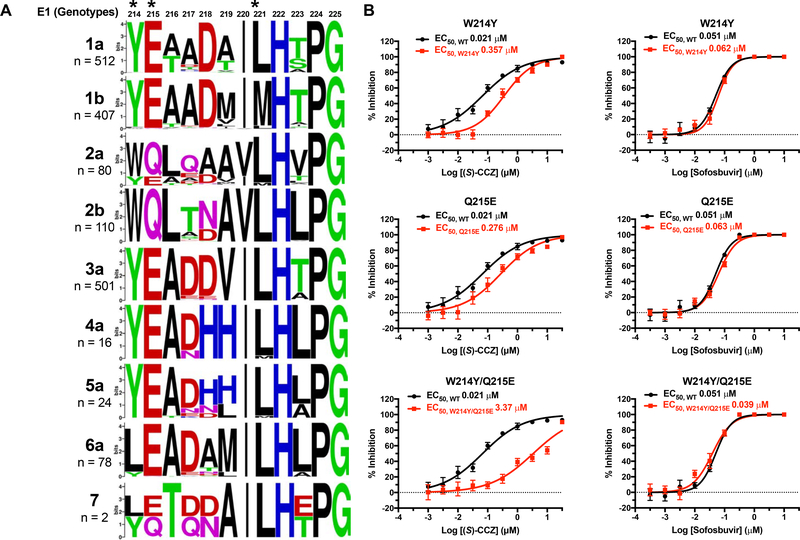
Figure 5. E1 sequences of (S)-CCZ cross-linking site and mutational analyses.
A. E1 Sequence comparison of various HCV genotypes near the major amino acid residues cross-linked with CCZ (marked by *) was shown as in Figure 1. B. Dose-response curves of (S)-CCZ against the HCV GT2a WT and mutants W214Y, Q215E and W214Y/Q215E. The experiment was performed in 96-well plates. Data points are expressed as mean values ± SEM from 6 samples (n = 6). The results are representative of three separate experiments.

