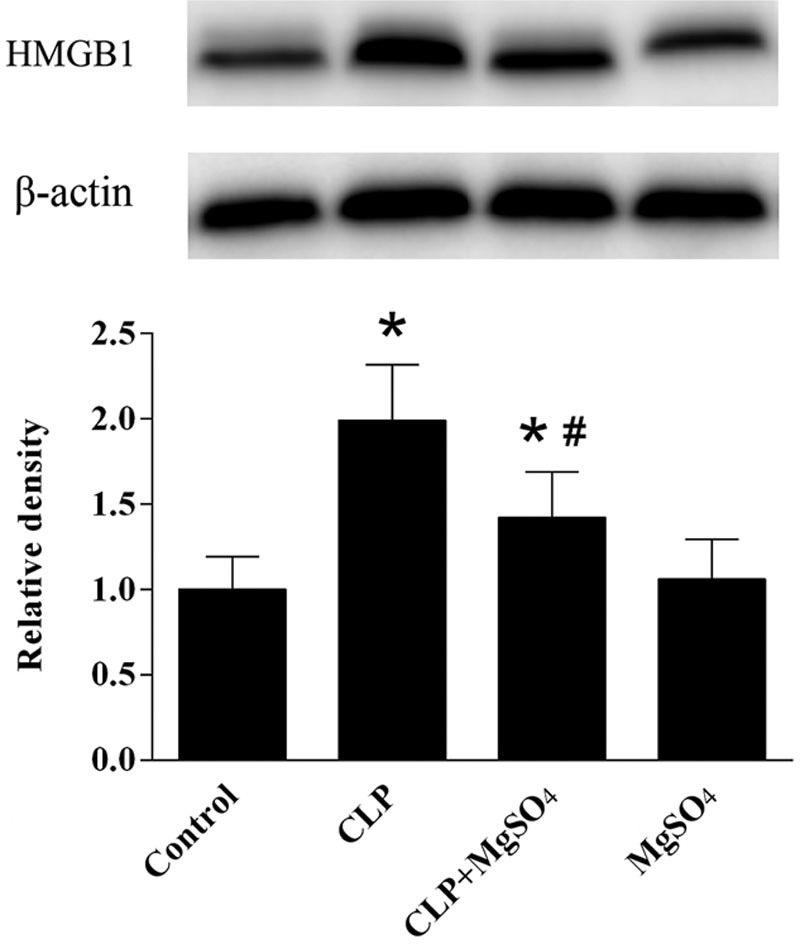
Fig. 4.

Changes in the expression of HMGB1 in rat diaphragm. A comparison of the relative densities of HMGB1 and β-actin are shown for the control, CLP, CLP + MgSO4 and MgSO4 groups. Data are shown as the means ± SE (n = 10). *P < 0.05 compared to the control group; #P < 0.05 compared to the CLP group. CLP, cecal ligation and puncture; HMGB1, high-mobility group box 1; MgSO4, magnesium sulfate.
