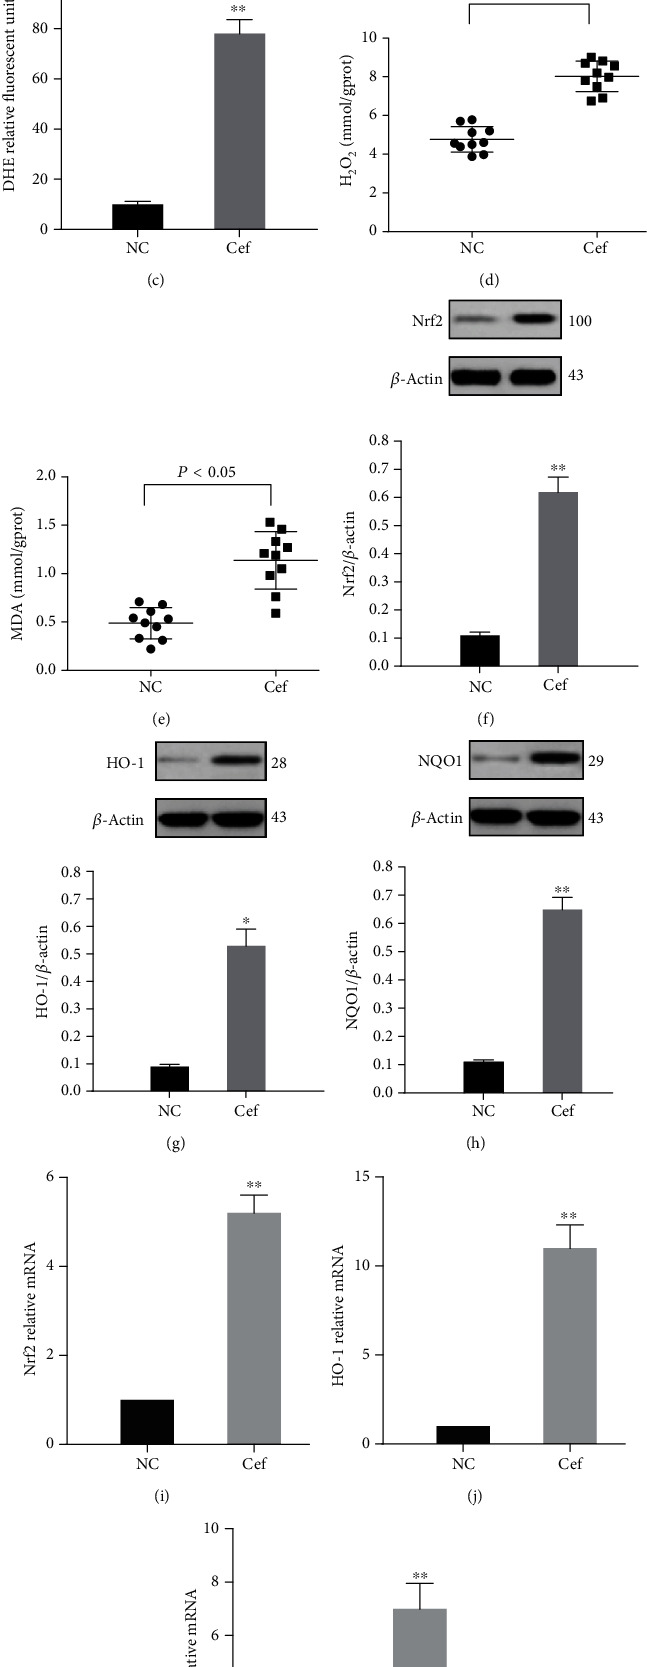
Figure 4.

Ceftriaxone calcium crystals increased oxidative stress. (a, b) DHE fluorescence in the kidney tissue ((a) NC group, (b) group 1, bars = 100 μm). (c) Graph representing mean DHE fluorescence. (d) Concentrations of H2O2 in the kidney tissue. (e) Concentrations of MDA in the kidney tissue. (f–h) Representative western blots and quantitative analysis for Nrf2 (f), HO-1 (g), and NQO1 (h) expression in the kidney tissues. β-Actin was used as the internal control. (i–k,) mRNA levels of Nrf2 (i), HO-1 (j), and NQO1 (k) in vivo (the results are expressed as mean ± SD; ∗P < 0.05 compared with the control group, ∗∗P < 0.01 compared with the control group).
