Figure 3.

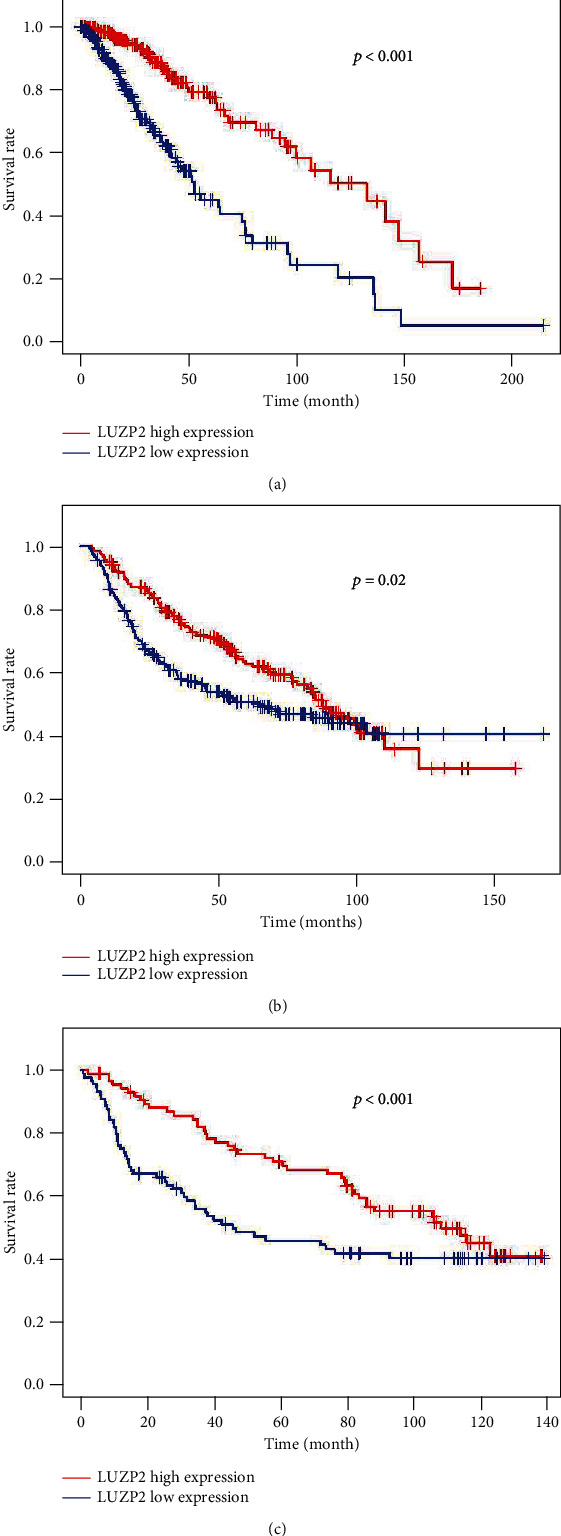
Kaplan-Meier survival analysis by median. (a) Kaplan-Meier curves of overall survival in TCGA. (b) Kaplan-Meier curves of overall survival in the CGGA part B dataset. (c) Kaplan-Meier curves of overall survival in the CGGA part C dataset.

Kaplan-Meier survival analysis by median. (a) Kaplan-Meier curves of overall survival in TCGA. (b) Kaplan-Meier curves of overall survival in the CGGA part B dataset. (c) Kaplan-Meier curves of overall survival in the CGGA part C dataset.