
Figure 4.
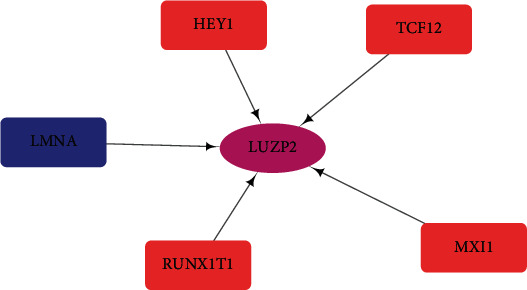
Regulatory network of TFGs and LUZP2. Red indicates that the overexpression of the TFG can upregulate LUZP2, while blue indicates that the overexpression of the TFG can downregulate LUZP2. The thicker the line, the higher the correlation coefficient.