FIGURE 2.

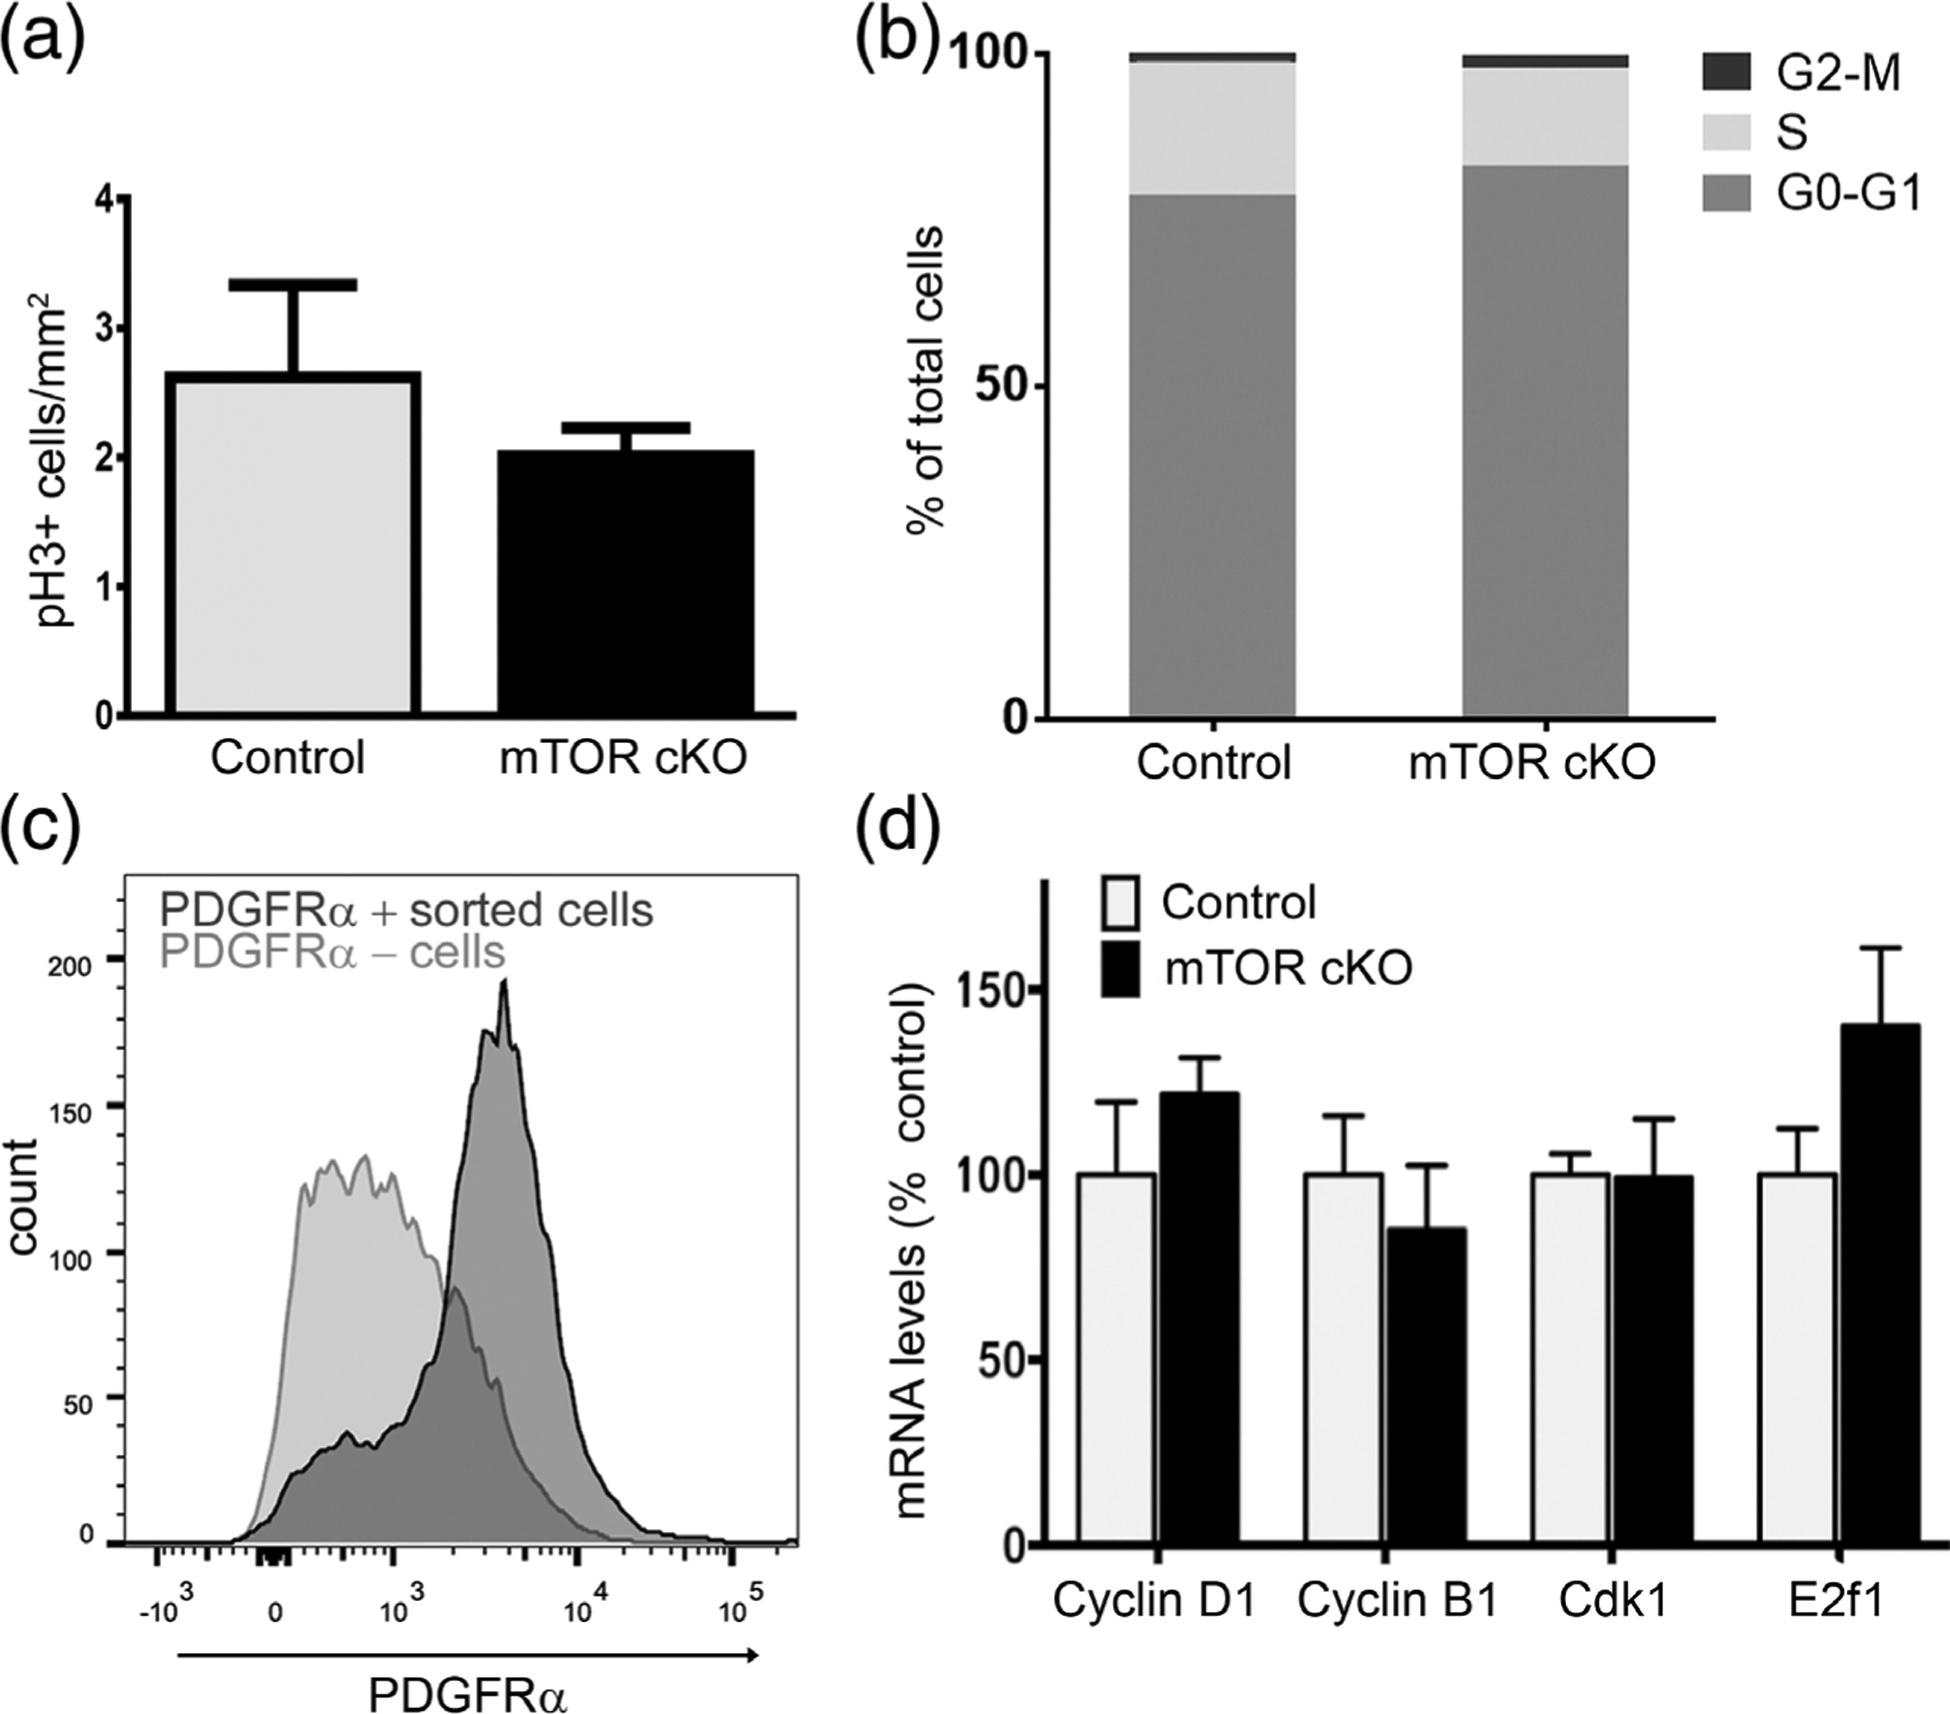
mTOR deletion does not alter cell proliferation or cell cycle exit. (a) Quantification of phospho-histone H3 (pH 3) immunofluorescence in spinal cord sections from control and mTOR cKO mice at PND10. Values expressed as mean ± SEM. (n = 3/genotype). (b) Cell cycle analysis of PDGFRα+ cells by flow cytometry. Spinal cords from control and mTOR cKO mice at PND10 were dissociated and stained with anti-PDGFRα and Hoescht. PDGFRα+ cell population was selected by gating, and cell cycle phase was determined based on the DNA content by Hoescht staining. (n = 3 controls, n = 5 mTOR cKO) (c) Representative graph showing sorting efficiency of PDGFRα+ cells. Dissociated cells from spinal cords at PND10 were incubated with PDGFRα antibody conjugated to magnetic microbeads and subjected to magnetic-activated cell sorting. Positive (dark gray) and negative (light gray) cell fractions were analyzed by flow cytometry to determine percentage of PDGFRα+ cells in each fraction. Eighty-three percent of the positive cell fraction is PDGFRα+; 37% of the negative fraction is PDGFRα+. (d) mRNA expression of genes involved in cell cycle regulation. Expression of cyclin D1, cyclin B1, Cdk1, E2f1 by quantitative real-time PCR in sorted PDGFRα+ cells from PND10 spinal cords. Data represent at least three independent experiments. In each experiment, cells were pooled from 3 to 4 mice/genotype. Values expressed as mean ± SEM
