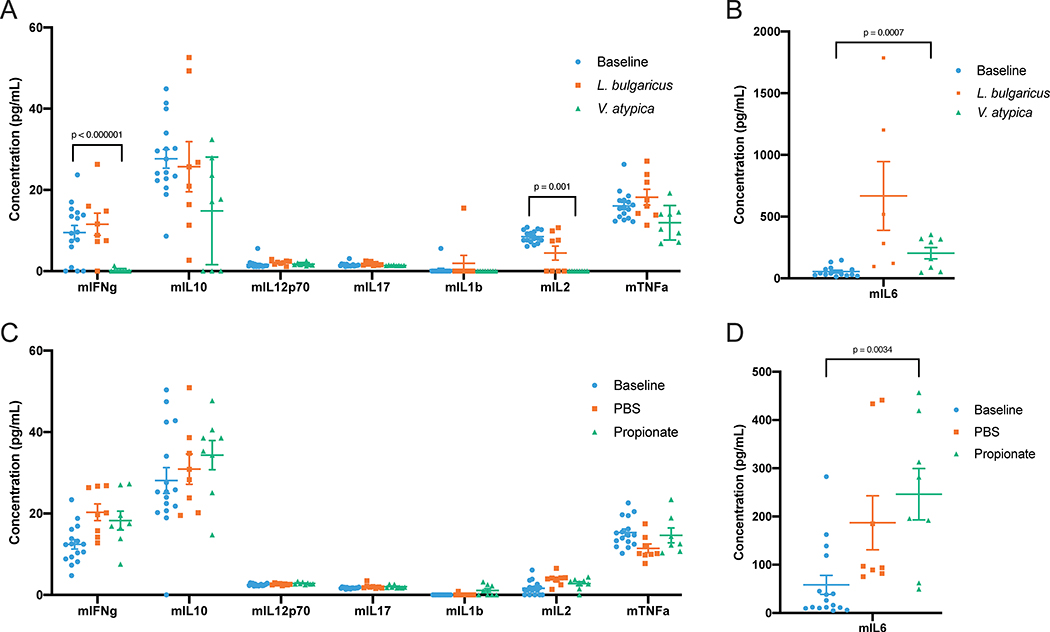
Extended Data 6:
A, B: Cytokines after V. atypica and L. bulgaricus gavage. Each mouse sample is represented as an individual point, with the central bar representing the mean and error bars representing s.e.m. (n = 64, 32, and 32, for baseline, L. bulgaricus, and V. atypica, respectively). C, D: Cytokines after intra-rectal propionate instillation. Each mouse sample is represented as an individual point, with the central bar representing the mean and error bars representing s.e.m. (n = 32, 16, and 16, for baseline, L. bulgaricus, and V. atypica, respectively). P values determined using one-way ANOVA followed by Tukey’s post-hoc test.

