
Figure 3.
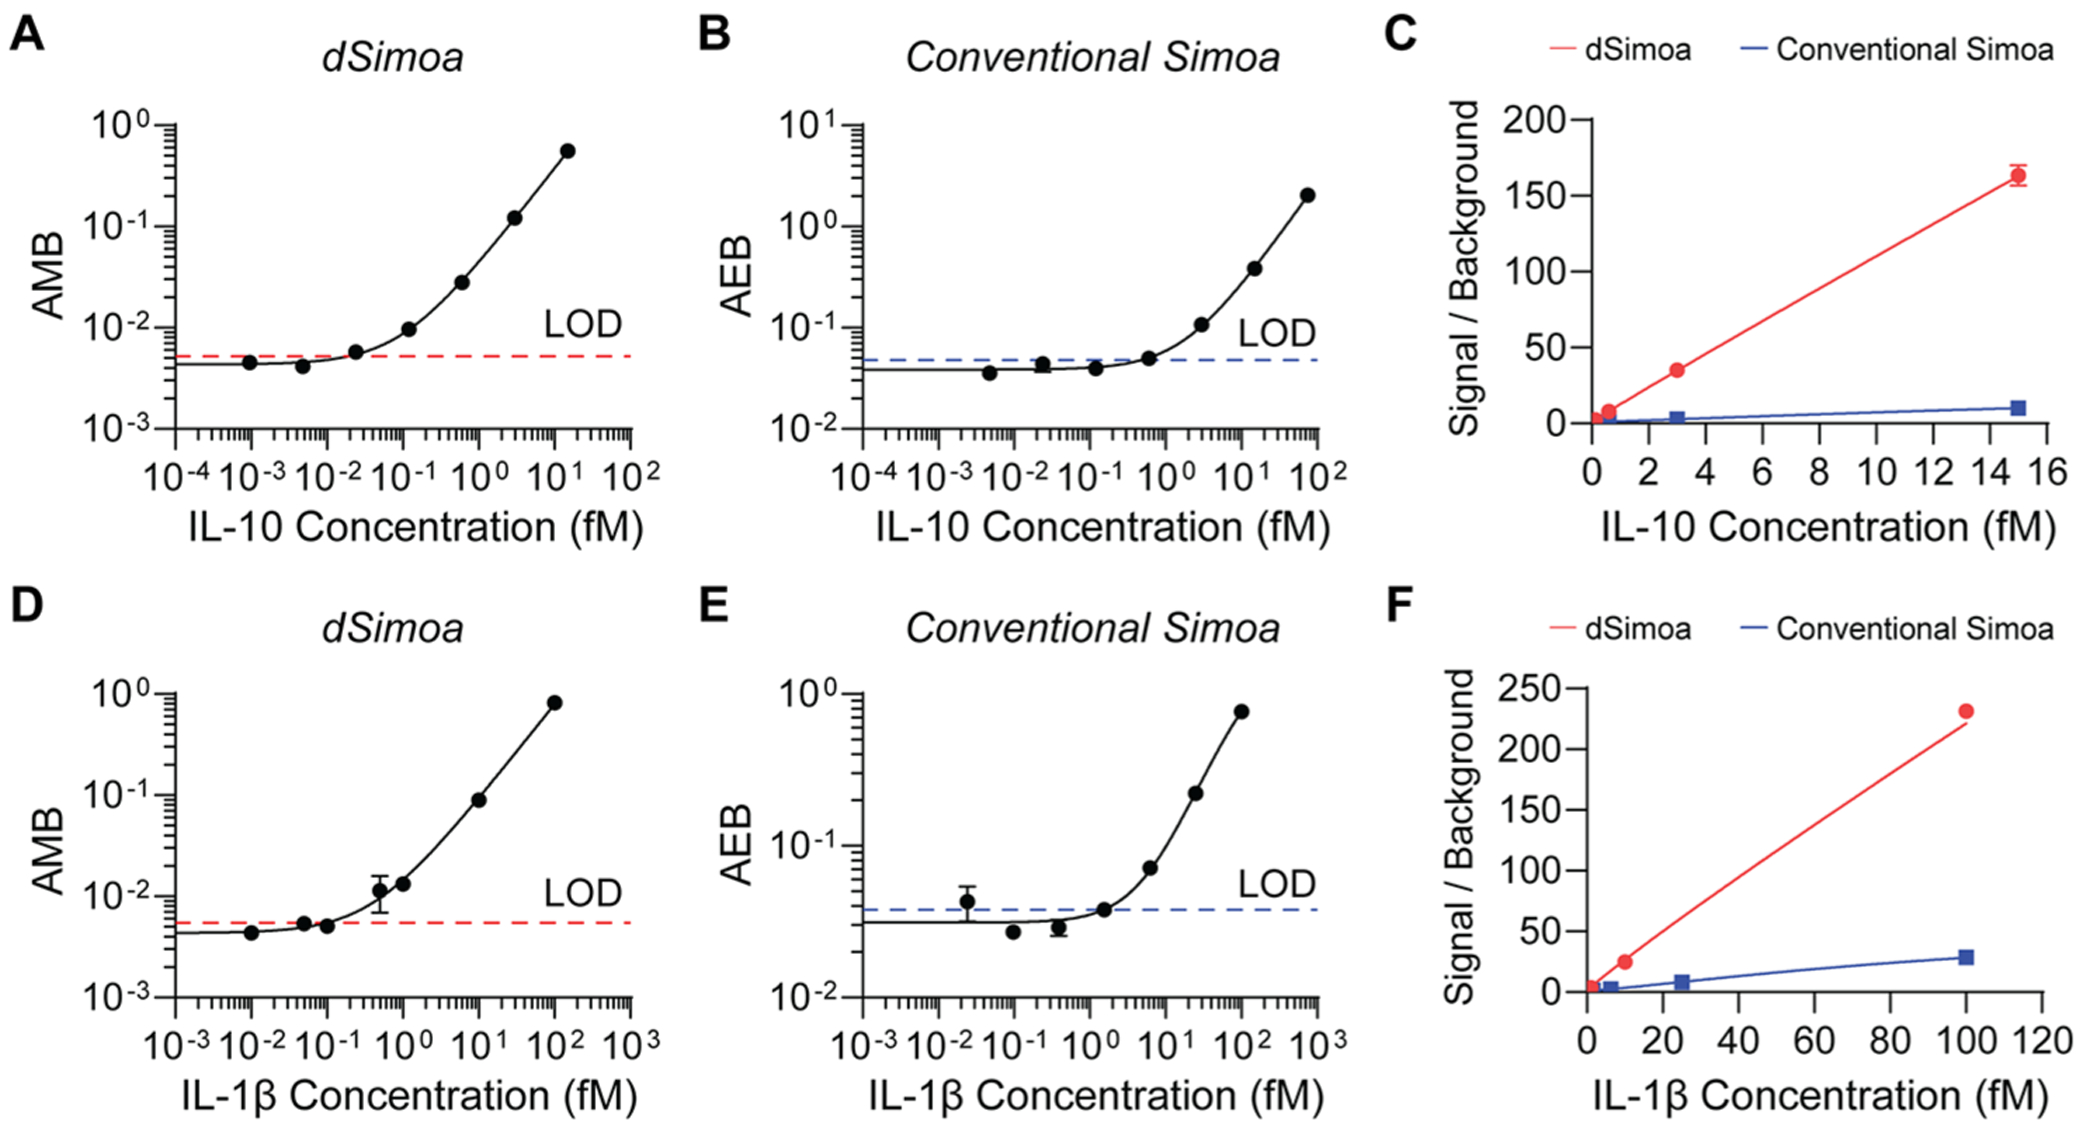
Comparisons of dSimoa and conventional Simoa assay sensitivities. (A) dSimoa and (B) conventional Simoa calibration curves for human IL-10. Dashed lines indicate the calculated limits of detection (LODs). (C) Comparison of signal to background ratios between dSimoa and conventional Simoa across the IL-10 calibration curve range. (D) dSimoa and (E) conventional Simoa calibration curves for human IL-1β. (F) Comparison of signal to background ratios between dSimoa and conventional Simoa across the IL-1β calibration curve range.