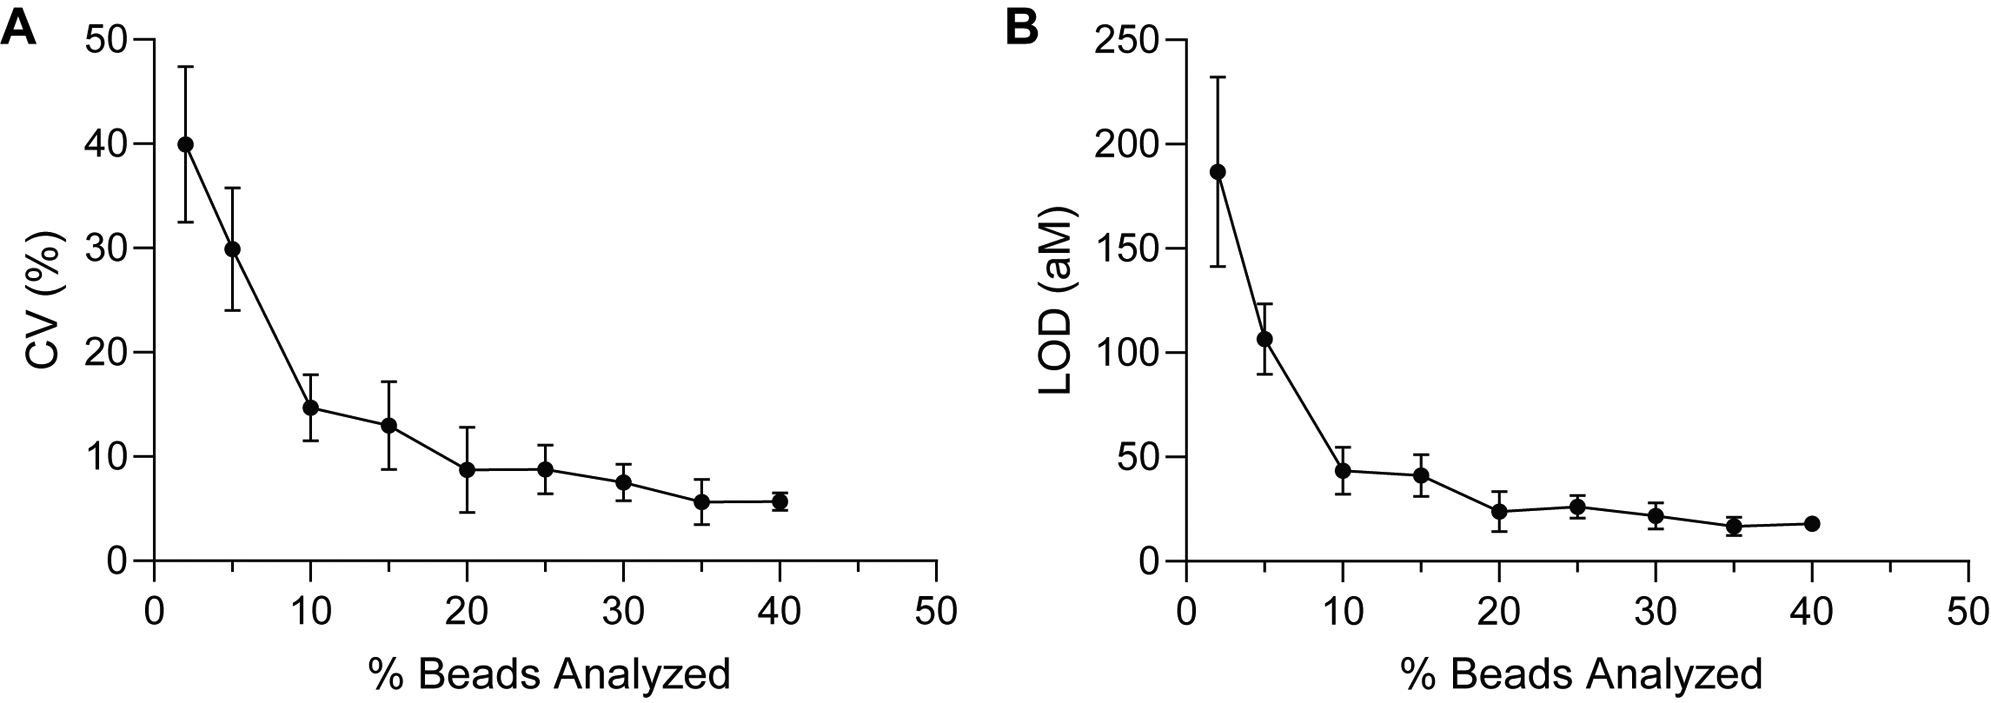
Figure 4.

Effect of sampling efficiency on measurement precision and sensitivity. (A) Measurement CVs of the background signal and (B) calculated LODs for randomly selected subsets of beads imaged in the dSimoa calibration curve for IL-10. The percentage of beads analyzed represents the percentage of total assay beads. Each point represents the average of four different randomly selected subsets of beads.
