Figure 5.

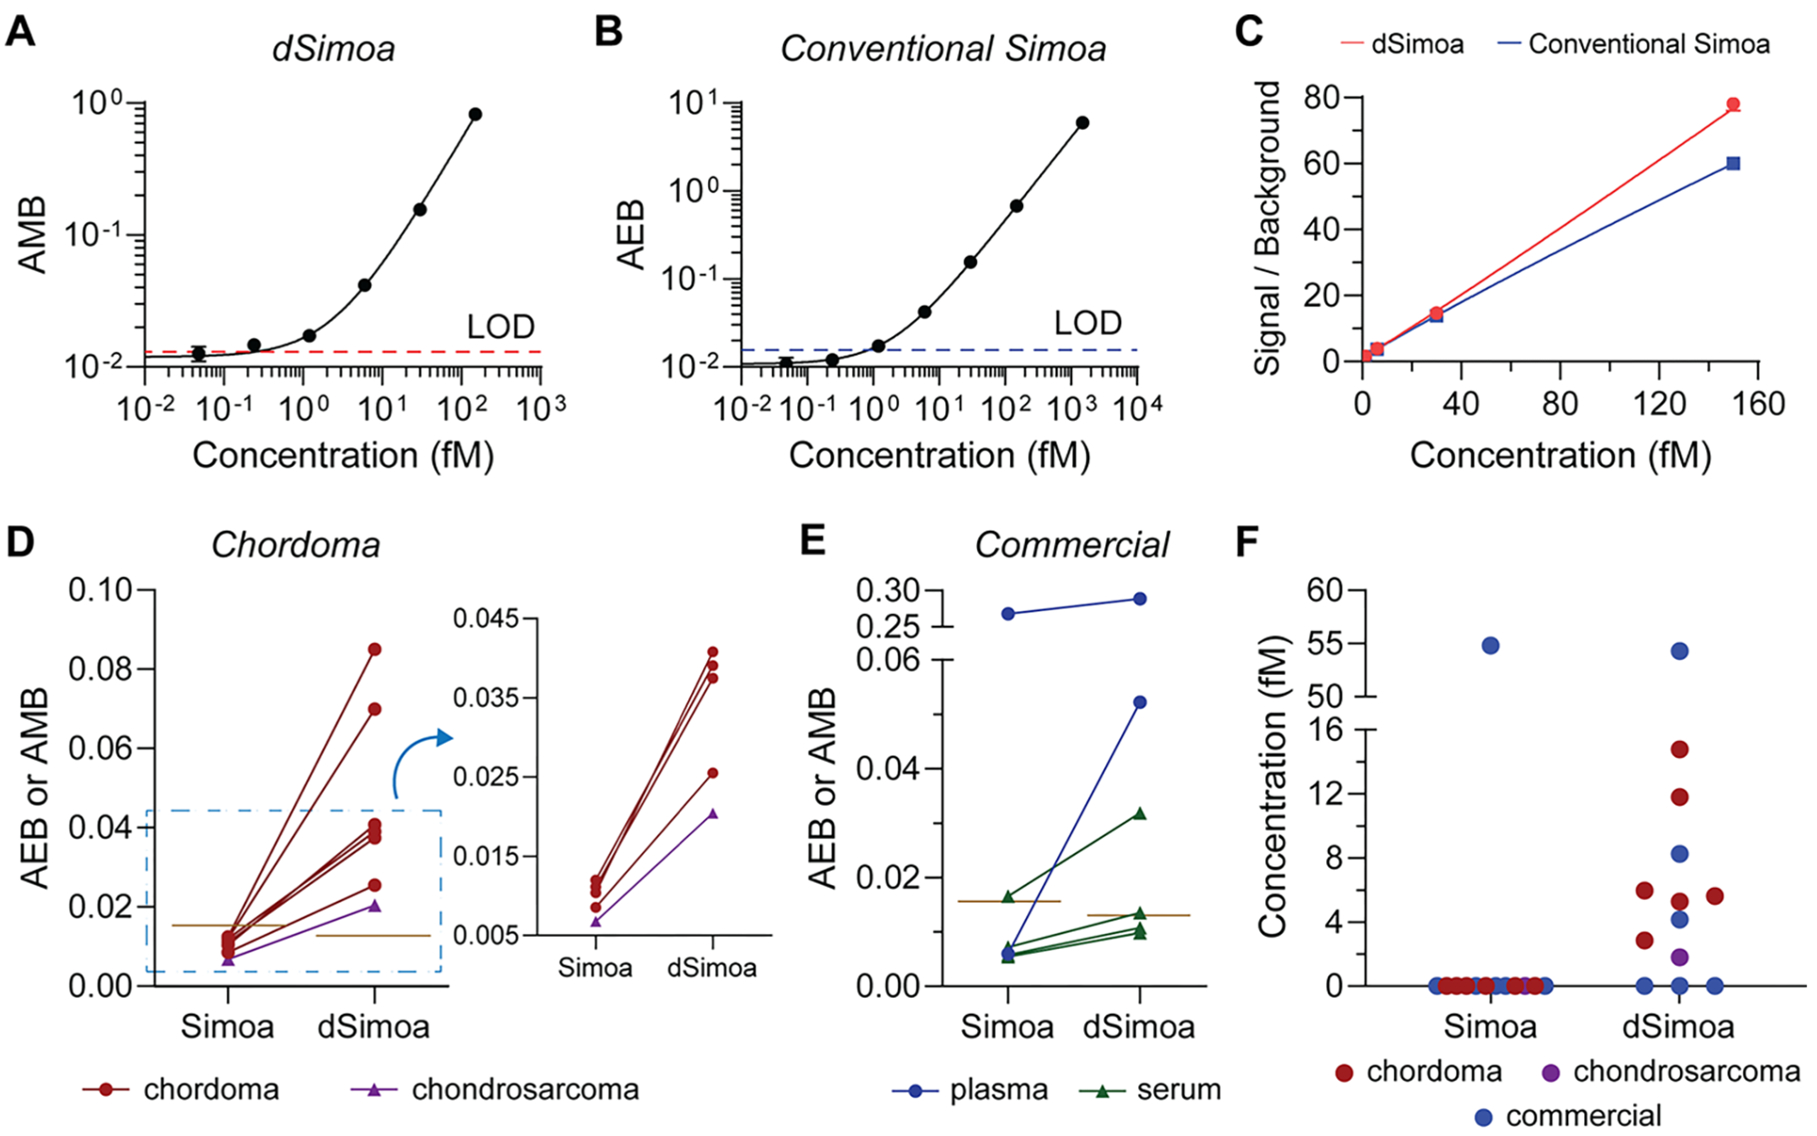
Measurements of Brachyury in plasma. (A) dSimoa and (B) conventional Simoa calibration curves for human Brachyury. Dashed lines indicate the calculated limits of detection (LODs). (C) Comparison of signal to background ratios between dSimoa and conventional Simoa across the calibration curve range. (D, E) Average enzyme per bead (AEB) and average molecule per bead (AMB) values measured by conventional Simoa and dSimoa, respectively, in chordoma and chondrosarcoma patient plasma samples (D) and commercial plasma and serum samples (E). Brown lines indicate LODs of the assays. (F) Measured concentrations in chordoma, chondrosarcoma, and commercial plasma and serum samples using dSimoa and conventional Simoa. Measurements below the LOD were assigned a value of zero.
