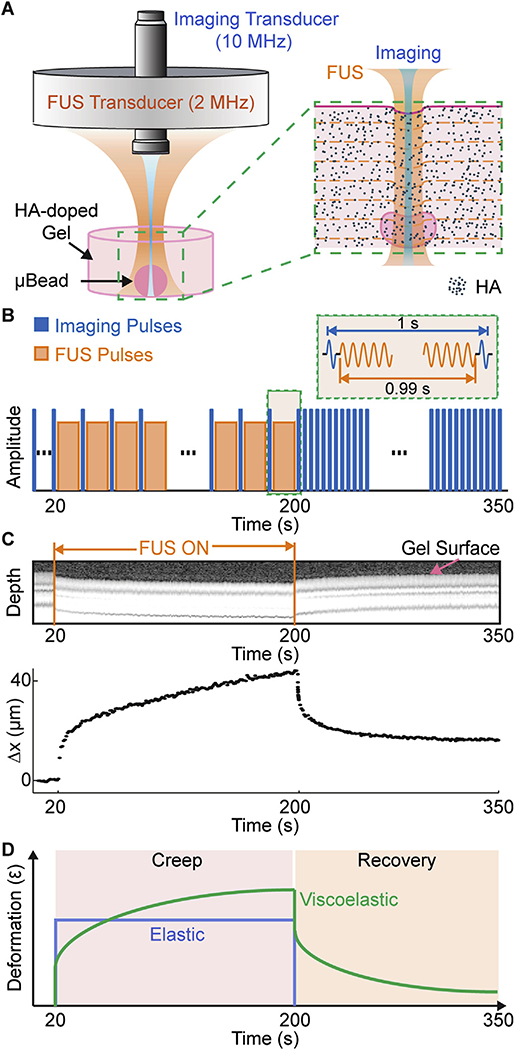
Fig. 1.
A) Schematic diagram of transducer set-up and expanded view of sample in MUVE. B) Schematic trace of the protocol for interleaving pushing (FUS) and imaging pulses during MUVE for creep testing. C) M-mode (Motion-mode) grayscale image and corresponding peak displacement versus time curve of agarose hydrogel sample showing deformation during application of FUS. D) Schematic of deformation versus time traces for elastic and viscoelastic materials during creep testing.

