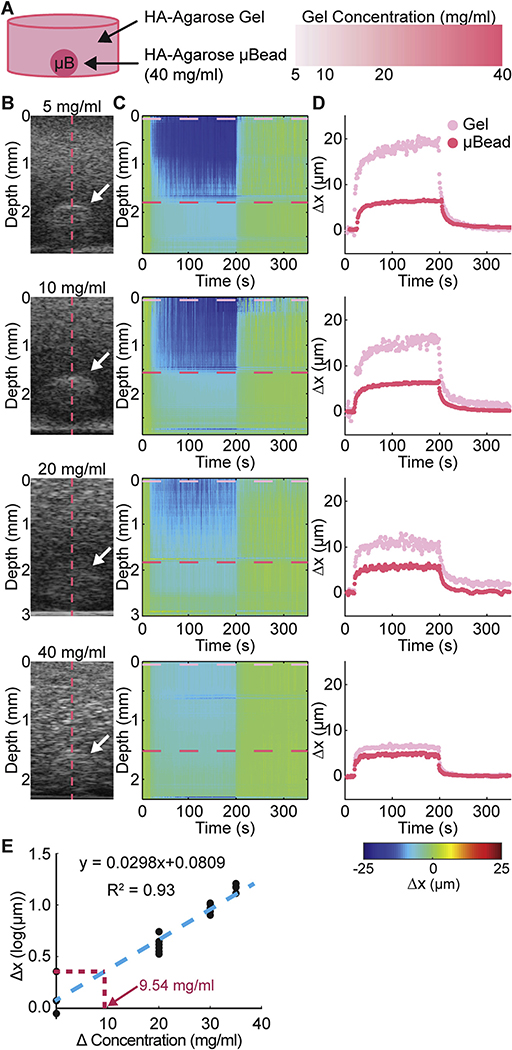
Fig. 5.
A) Schematic of sample configuration showing high concentration agarose microbead embedded within a surrounding hydrogel. Microbead concentration was varied to determine the detectivity of MUVE. B) Grayscale image of sample and microbead (white arrow). C) Color map of deformation through depth of the sample over time. D) Peak displacement profile of the surrounding hydrogel (pink trace) and the embedded microbead (red trace). E) Plot of measured deformation difference versus actual concentration, showing theoretical detectivity of MUVE. (For interpretation of the references to colour in this figure legend, the reader is referred to the web version of this article.)

