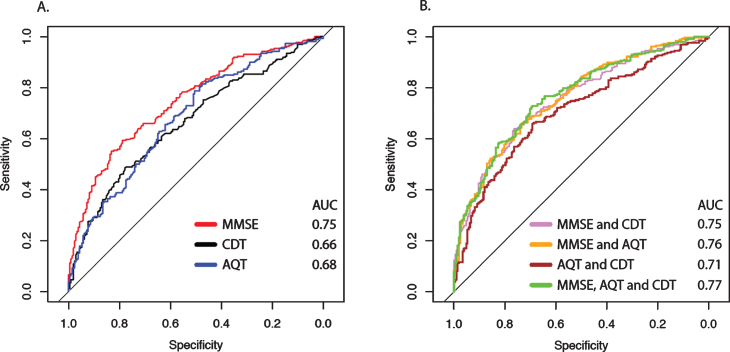
Fig.2.
ROC curves from logistic regression models for identifying MCI. A shows the ROC curves of the individual cognitive tests adjusted for age and education in logistic regression models with classification (SCD or MCI) as outcome variable. B shows the different combinations of tests, also adjusted for age and education. See Table 3 for more details. AUC, Area under the Curve; MMSE, Mini-Mental State Examination; AQT, A Quick Test of Cognitive Speed; CDT, Clock Drawing Test.

