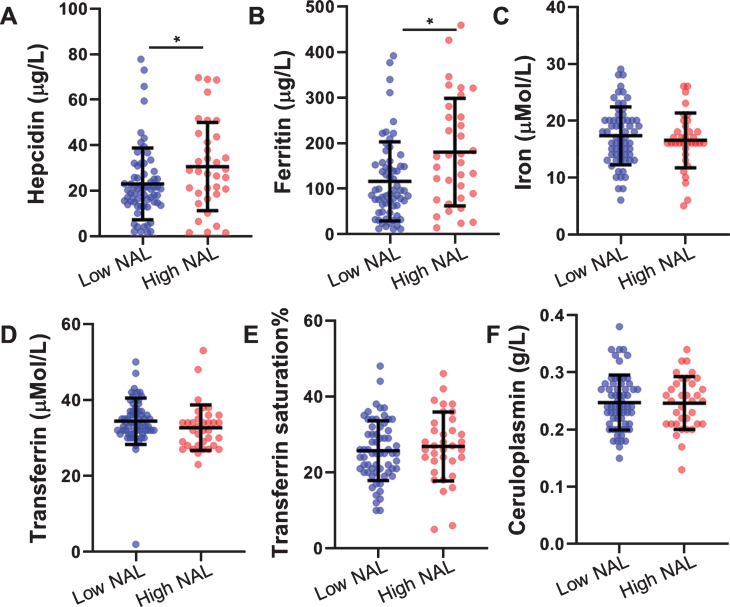
Fig.1.
Comparison of serum hepcidin and other iron related proteins between participants with low and high NAL. A) Serum hepcidin (n low NAL = 65, n high NAL = 35), B) serum ferritin (n low NAL = 64, n high NAL = 34), C) serum iron (n low NAL = 64, n high NAL = 35), D) transferrin (n low NAL = 64, n high NAL = 35), E) transferrin saturation% (n low NAL = 64, n high NAL = 35), and F) ceruloplasmin (n low NAL = 63, n high NAL = 35) were compared between participants with high NAL and low NAL. Serum hepcidin (p = 0.036) and ferritin (p = 0.013) were significantly higher in high NAL compared to low NAL, while the other measures were non-significant (p > 0.05). Error bars represent standard deviation and line segments represent the mean. *represents p < 0.05. NAL, neocortical amyloid-β load.

