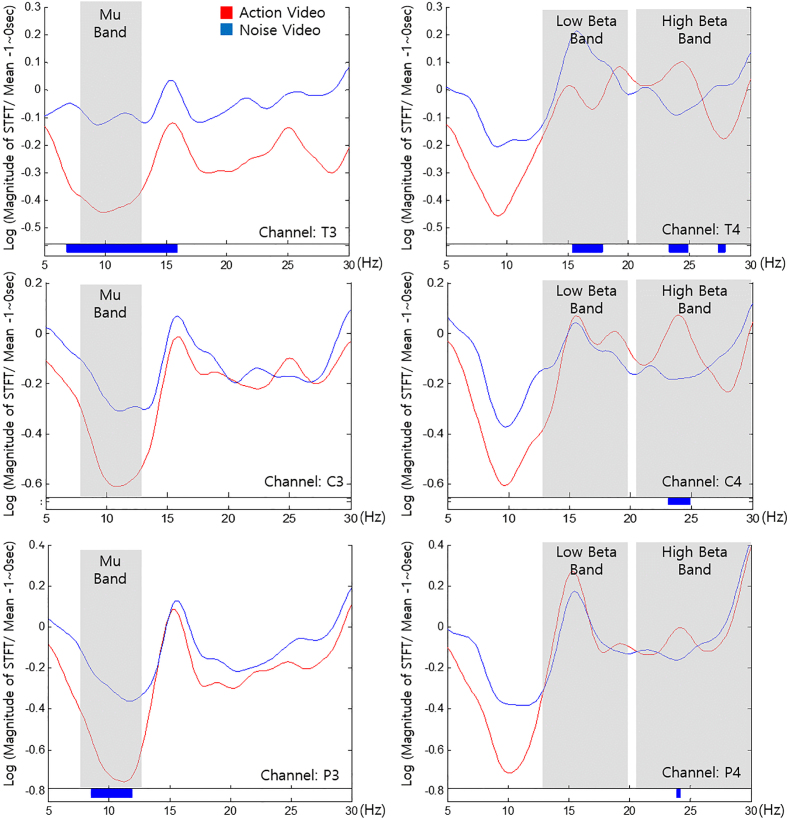
Figure 4.
Frequency components obtained from channels (a) T3, (b) T4, (c) C3, (d) C4, (e) P3, and (f) P4 while watching action video (red) and noise videos (blue) of the game program. Paired-t test was performed for identifying significant differences. Significant ranges ( 0.05) have been indicated as blue lines under the graphs.

