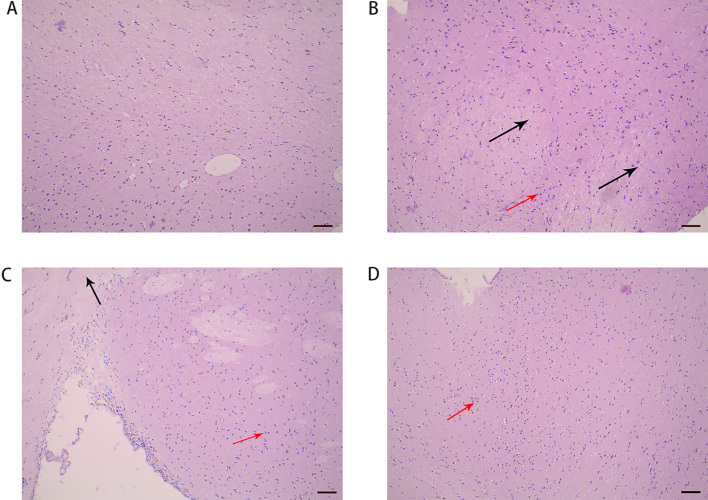
Figure 4.
Hippocampus histomorphology of the groups: control (A), model (B), WTKYR (C), and fluoxetine group (D). It was noted that hippocampus histomorphology of the control group was normal. Moderate pyramidal cell edema and infiltration of inflammatory cells were observed in the model group. There was lighter cell edema and inflammation in the rats’ hippocampus tissue of the fluoxetine and WTKYR groups. The black arrows in Fig. 4 point to the cell edema, and the red point to the inflammatory cell infiltration. Bar 100 m.

