Fig.1.
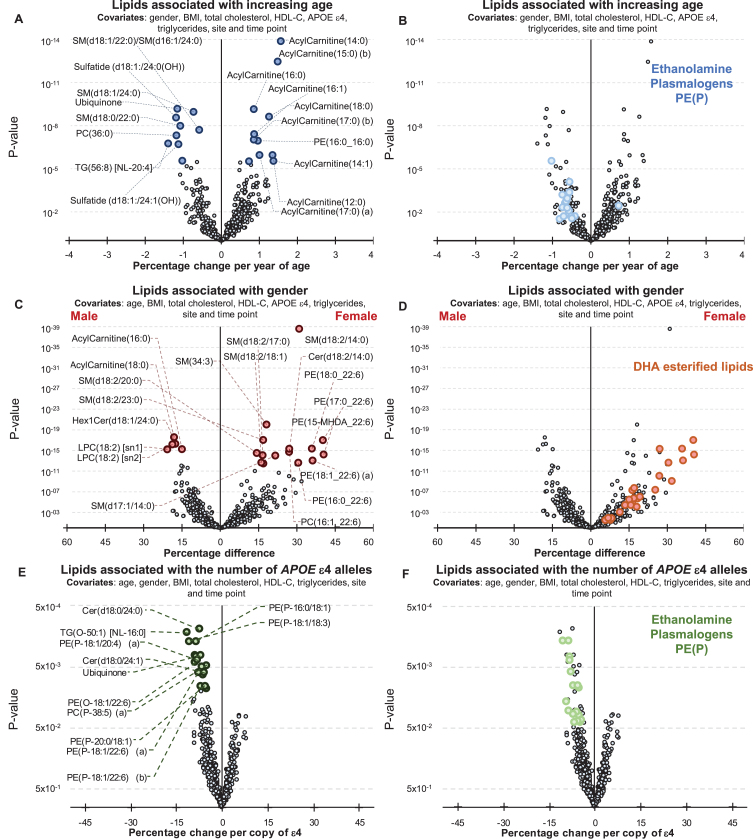
Associations between Alzheimer’s disease risk factors and plasma lipid species. Linear regression analyses of risk factors against plasma lipid species were performed adjusting for covariates as indicated. The most recent available sample of each healthy control individual were used (n = 696). A, B) Associations between plasma lipids and aging. A) Lipids with a p-value less than 3.01×10⁻⁶ (top 20) are highlighted in blue. B) Ethanolamine plasmalogens, PE(P), with p < 0.05 are highlighted in light blue. C, D) Associations between lipids and gender. C) Lipids with a p-value less than 3.25×10⁻¹³ (top 20) are highlighted in red. D) Glycerophospholipids esterified with a 22:6 fatty acid with p < 0.05 (DHA, docosahexaenoic acid) are highlighted in orange. E, F) Associations between lipids and APOE ɛ4 status. E) Lipids with a p-value less than 1.13×10⁻² (top 20) are highlighted in green. F) Ethanolamine plasmalogens, PE(P), with p < 0.05 are highlighted in light green.

