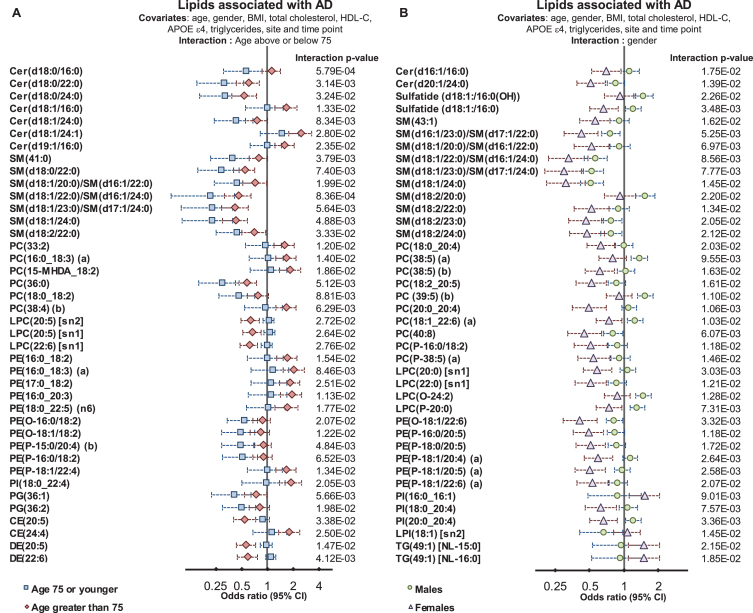
Fig.3.
Interactions of age and gender with the associations between plasma lipid species and Alzheimer’s disease. Regression analysis with an interaction term identified lipid species that associated with AD differently in relation to age and gender. Analysis were adjusted for age, gender, BMI, total cholesterol, HDL cholesterol, triglycerides, site, and time-point of collection (n = 696 controls, 268 AD). A) Logistic regression examining lipid species associations with AD with an age interaction (stratified above and below 75 years of age). B) Logistic regression examining lipid species associations with AD with a gender interaction.

