
Fig. 2.
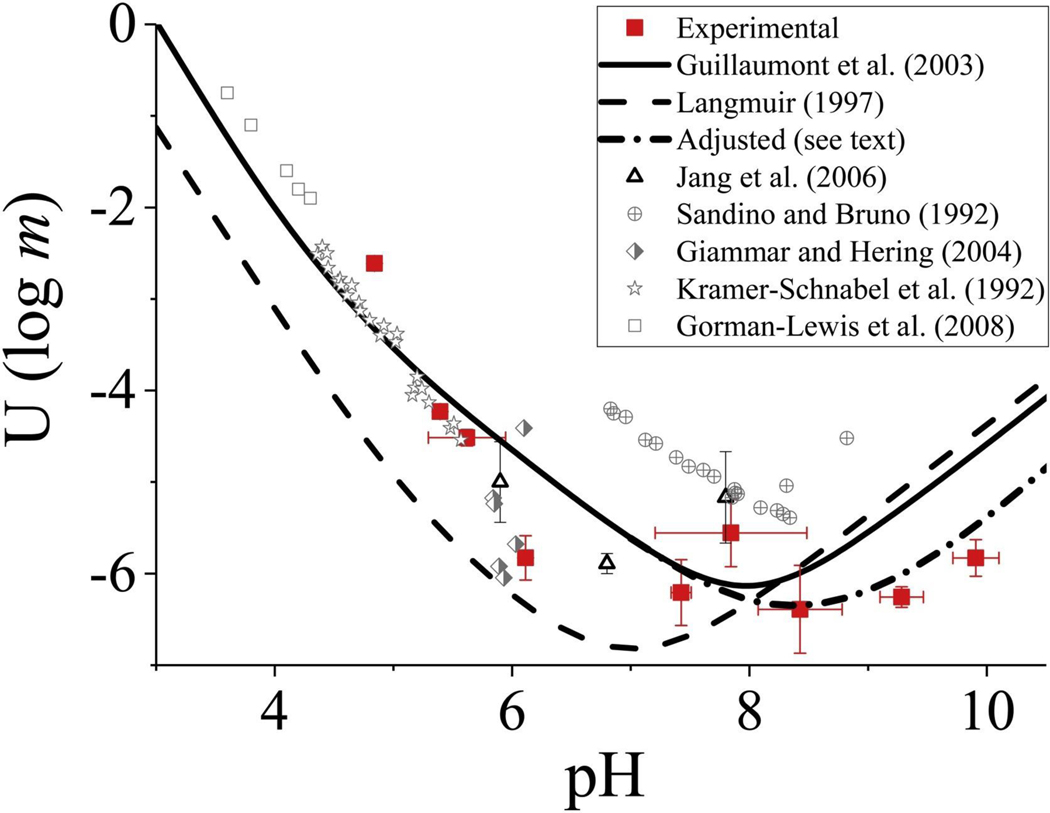
Uranium solubility diagram for metaschoepite with theoretical curves (lines) and experimental measurements (symbols; experimental data from this study are shown with red squares) as log molality of U versus pH [data sources: 23, 30, 34–38]. Uncertainty is based on pH and U concentration data collected over 58 days (Table S2) (For interpretation of the references to colour in this figure legend, the reader is referred to the web version of this article.).